 ReginaTagebücher
 Param Publication
1. Data Handling
- Books Name
- CBSE Class 6 Mathematics Book
- Publication
- Param Publication
- Course
- CBSE Class 6
- Subject
- Mathmatics
Introduction
Data :
Data is the collection of information or facts . It may be a collection of numbers , figures ,words ,or symbols.
Raw Data :
The data that has been collected in the original form is called raw data.
For example :
The marks obtained by 10 students in the Maths exam are 60, 40, 35, 27, 67, 72, 40, 37, 45, 50. This collection of data is raw data.
Type of Data
Thus, primary data are original whereas secondary data are not original.
Organization of Data
To draw a meaningful conclusion from the data, the data must be organized. Understanding and analyzing the data becomes easier when it is represented by pictures or tables.
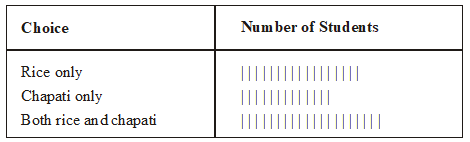
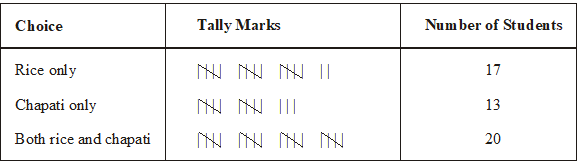
Ex.: A teacher wants to know the choice of food of each student as part of the mid-day meal program. The teacher assigns the task of collecting this information to Maria. Maria does so using paper and a pencil. After arranging the choices in a column, she puts against a choice of food one ( | ) mark for every student making that choice.
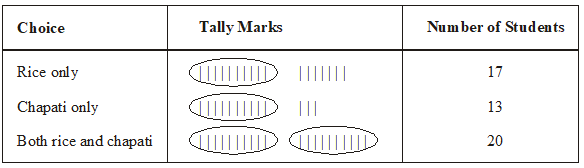
Umesh, after seeing the table suggested a better method to count the students. He asked Maria to organize the marks ( | ) in a group of ten as shown below :
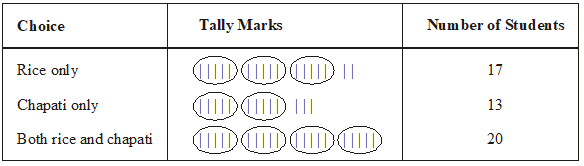
Rajan made it simpler by asking her to make groups of five instead of ten, as shown below:
Frequency Distribution
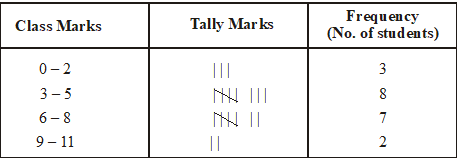
The number of times a particular observation occurs is called its frequency. In a class marks obtained by 20 students are as follows : 1, 2, 3, 4, 5, 4, 6, 6, 8, 9, 10, 2, 3, 3, 5, 3, 6, 8, 8, 7
This row data can be represented in meaning full manner.
Representation of Data
- Books Name
- CBSE Class 6 Mathematics Book
- Publication
- Param Publication
- Course
- CBSE Class 6
- Subject
- Mathmatics
Representation of Data
We have learnt how to collect the information and how to organize it using a frequency table. To represent the study of this data, we can draw graphs for this data.
Pictographs and bar graphs are simple ways of representing this data.
1. Pictograph : A pictograph represents data through pictures of objects. It helps answer the questions on the data at a glance. We represent the data using pictures as following example :
Ex. A cupboard has five compartments. In each compartment a row of books is arranged. The details are indicated in the adjoining table :
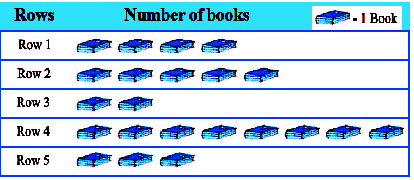
By seeing above pictograph we can easily get information that Row 4 has the greatest number of books. Row 3 has the least number of books and no Row which does not have books.
Interpretation of a Pictograph :
Ex.1 The following pictograph shows the number of absentees in a class of 30 students during the previous week :
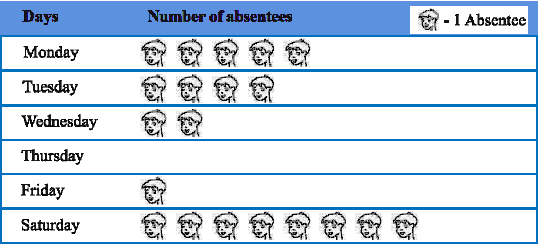
(a) On which day were the maximum number of students absent?
(b) Which day had full attendance?
(c) What was the total number of absentees in that week?
Sol : (a)Maximum absentees were on saturday. (There are 8 pictures in the row for saturday; on all other days, the number of pictures are less).
(b) Against thursday, there is no picture, i.e. no one is absent. Thus, on that day the class had full attendance.
(c) There are 20 pictures in all. So, the total number of absentees in that week was 20.
Ex.2 A survey was carried out on 30 students of class VI in a school. Data about the different modes of transport used by them to travel to school was displayed as pictograph. What can you conclude from the pictograph?
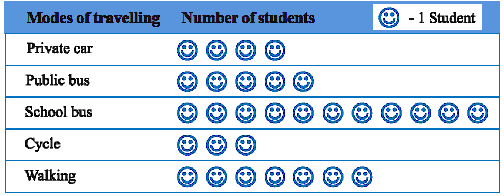
Sol. From the pictograph we find that:
(a) The number of students coming by private car is 4.
(b) Maximum number of students use the school bus. This is the most popular way.
(c) Cycle is used by only three students.
(d) The number of students using the other modes can be similarly found.
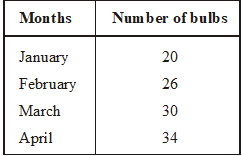
Drawing a Pictograph :
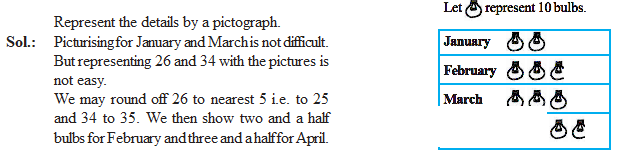
Ex.3 The following are the number of electric bulbs purchased for a lodging house during the first four months of a year.
2. Bar Graph: Sometimes representing data by pictograph is difficult due to large data. There is another way of representing data visually is Bar Graph. Bars of uniform width can be drawn horizontally or vertically with equal spacing between them and then the length of each bar represents the given number. Such a method of representing data is called a bar diagram or a bar graph.
Construction of a bar graph
- Books Name
- CBSE Class 6 Mathematics Book
- Publication
- Param Publication
- Course
- CBSE Class 6
- Subject
- Mathmatics
Construction of a bar graph :
Steps :
1. On the graph paper draw a horizontal line (x-axis) and a vertical line (y-axis)
2. Along the horizontal line, mark points at equal distances and write the names of the items for which the data is to be represented.
3. Choose a suitable scale which shall determine the height of the bars.
4. Locate the heights of different bars according to scale.
5. On x-axis draw bars of equal width according to the required height.
6. Keep the distance between the bars the same.
Drawing a bar graph : Let us draw a bar graph for this data.
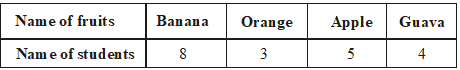
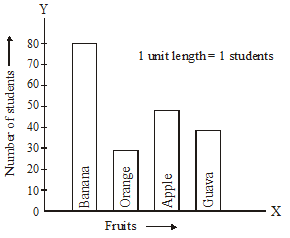
First of all draw a horizontal line and a vertical line. On the horizontal line we will draw bars representing each fruit and on vertical line we will write numerals representing number of students.
Let us choose a scale. It means we first decide how many students will be represented by unit length of a bar.
Here, we take 1 unit length to represent 1 student only. We get a bar graph as shown in adjoining figure.
Ex. 4 : Read the bar graph given below and answer the following questions.
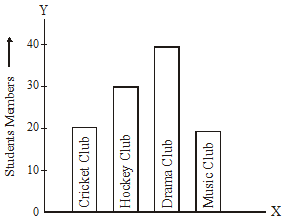
(i) What is the total number of students in all the clubs together ?
Sol. 20 + 30 +40 + 20 = 110 students
(ii) Which club has more students and how many ?
Sol. Drama club, 40 students
(iii) Which club have equal number of students ?
Sol. Cricket club and music club
(iv) How any students are there in hockey club ?
Sol. 30 students.
(v) What information is given in the bar graph ?
Sol. The bar graph represetns the number of members of different sports clubs.
Average
- Books Name
- CBSE Class 6 Mathematics Book
- Publication
- Param Publication
- Course
- CBSE Class 6
- Subject
- Mathmatics
Average
Average is equal to the sum of observation dividing by the number of observation.
![]()
Ex.1 Find the average of all prime numbers between 30 and 50.
Sol. There are five prime numbers between 30 and 50.
They are 31, 37, 41, 43, and 47
![]()
Ex.2 Find the average of first 5 multiples of 7.
![]()
