Param Publication
 ReginaTagebücher
- Books Name
- CBSE Class 6 Mathematics Book
- Publication
- Param Publication
- Course
- CBSE Class 6
- Subject
- Mathmatics
Introduction
Data :
Data is the collection of information or facts . It may be a collection of numbers , figures ,words ,or symbols.
Raw Data :
The data that has been collected in the original form is called raw data.
For example :
The marks obtained by 10 students in the Maths exam are 60, 40, 35, 27, 67, 72, 40, 37, 45, 50. This collection of data is raw data.
Type of Data
Thus, primary data are original whereas secondary data are not original.
Organization of Data
To draw a meaningful conclusion from the data, the data must be organized. Understanding and analyzing the data becomes easier when it is represented by pictures or tables.
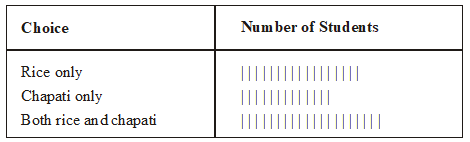
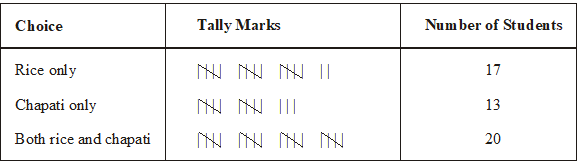
Ex.: A teacher wants to know the choice of food of each student as part of the mid-day meal program. The teacher assigns the task of collecting this information to Maria. Maria does so using paper and a pencil. After arranging the choices in a column, she puts against a choice of food one ( | ) mark for every student making that choice.
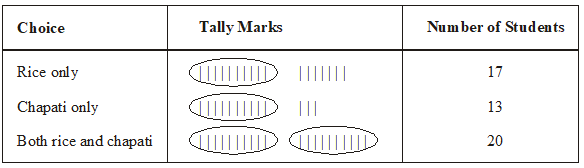
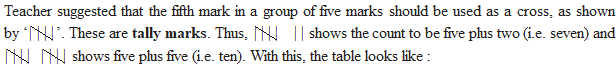
Umesh, after seeing the table suggested a better method to count the students. He asked Maria to organize the marks ( | ) in a group of ten as shown below :
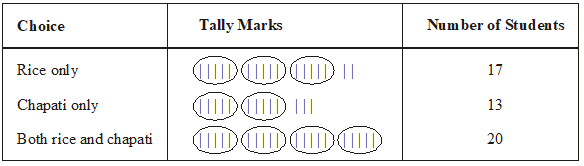
Rajan made it simpler by asking her to make groups of five instead of ten, as shown below:
Frequency Distribution
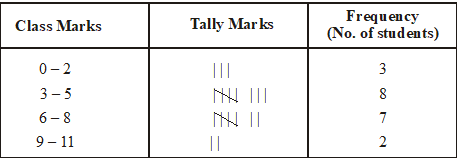
The number of times a particular observation occurs is called its frequency. In a class marks obtained by 20 students are as follows : 1, 2, 3, 4, 5, 4, 6, 6, 8, 9, 10, 2, 3, 3, 5, 3, 6, 8, 8, 7
This row data can be represented in meaning full manner.
- Books Name
- Class 6 Mathematics Book
- Publication
- ReginaTagebücher
- Course
- CBSE Class 6
- Subject
- Mathmatics
Chapter 9
Data Handling
Introduction to data,
Data handling is appertained to the procedure done to organize the information handed in order to perform fine operations on them.
Scoring or marks, measuring height/ weight, calculating distance travelled are all data for different situations. In our day-to-day life, raw information or data, in terms of volume or numbers is used regularly.
Below are a many examples.
Classification of data
Tally mark,
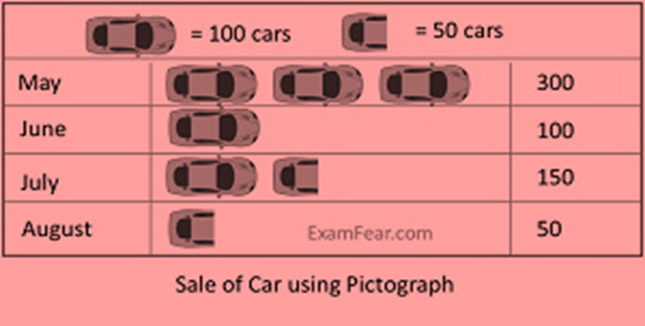
Pictographs,
It is a representation in terms of pictures/symbols.
.
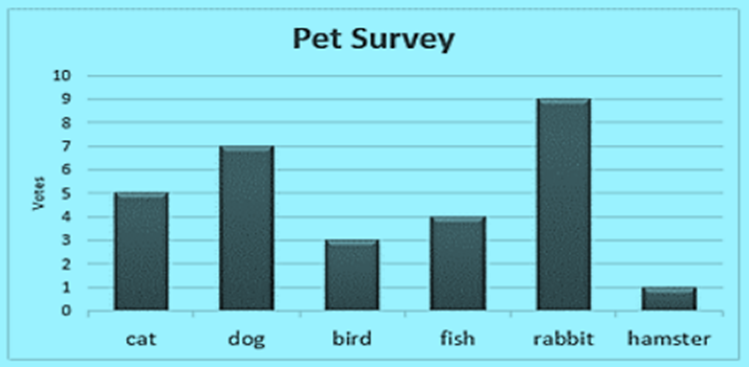
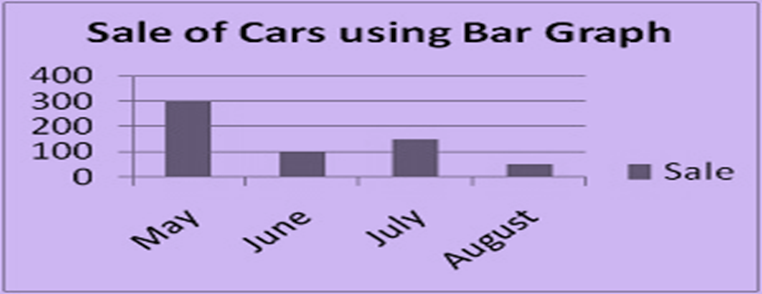
Bar graph
Information is displayed in terms of bars of equal width and equal gap in between. The heights are proportional to the values they represent.
Classification of bar graphs,
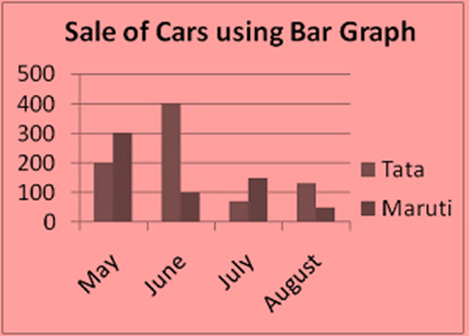
Double Bar Graph
Information is displayed for two sets of data in terms of bars together. This is used for comparison of data.
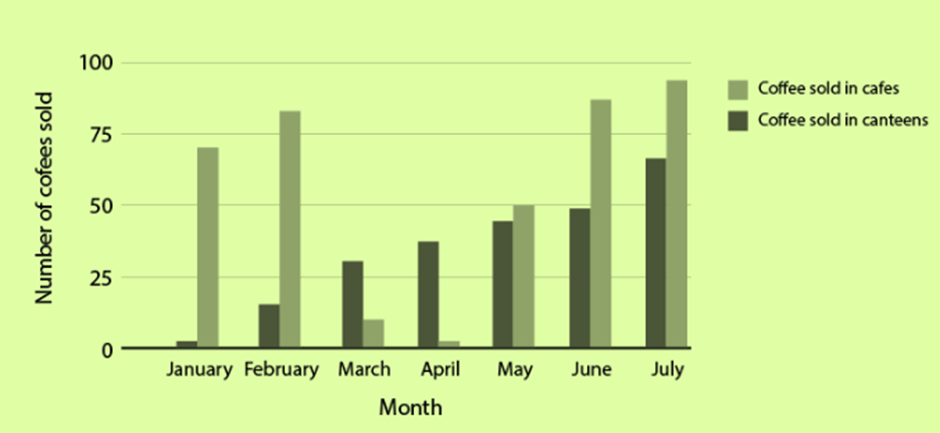
Multiple Bar Graphs
Multiple bar graphs are a bar graph, which is used for comparing more than one kind of information.
Example:
Construct simple bar graph
In the bar graph, the information represented by the bars of the same width with equal gaps but the height of the bars represents the respective values.