 ReginaTagebücher
 Param Publication
- Books Name
- CBSE Class 6 Mathematics Book
- Publication
- Param Publication
- Course
- CBSE Class 6
- Subject
- Mathmatics
Introduction
Data :
Data is the collection of information or facts . It may be a collection of numbers , figures ,words ,or symbols.
Raw Data :
The data that has been collected in the original form is called raw data.
For example :
The marks obtained by 10 students in the Maths exam are 60, 40, 35, 27, 67, 72, 40, 37, 45, 50. This collection of data is raw data.
Type of Data
Thus, primary data are original whereas secondary data are not original.
Organization of Data
To draw a meaningful conclusion from the data, the data must be organized. Understanding and analyzing the data becomes easier when it is represented by pictures or tables.
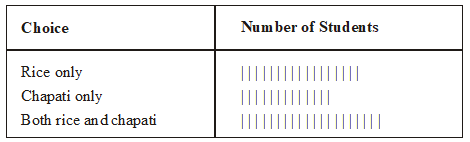
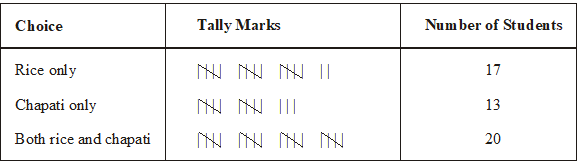
Ex.: A teacher wants to know the choice of food of each student as part of the mid-day meal program. The teacher assigns the task of collecting this information to Maria. Maria does so using paper and a pencil. After arranging the choices in a column, she puts against a choice of food one ( | ) mark for every student making that choice.
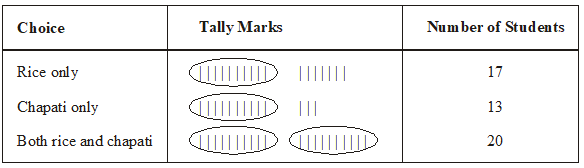
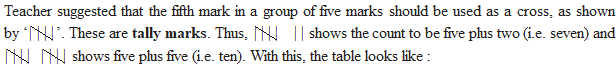
Umesh, after seeing the table suggested a better method to count the students. He asked Maria to organize the marks ( | ) in a group of ten as shown below :
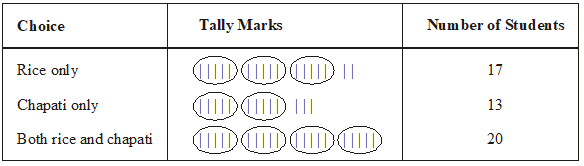
Rajan made it simpler by asking her to make groups of five instead of ten, as shown below:
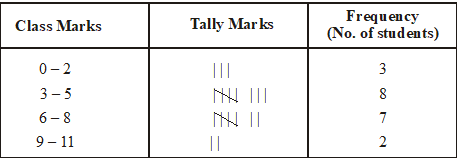
Frequency Distribution
The number of times a particular observation occurs is called its frequency. In a class marks obtained by 20 students are as follows : 1, 2, 3, 4, 5, 4, 6, 6, 8, 9, 10, 2, 3, 3, 5, 3, 6, 8, 8, 7
This row data can be represented in meaning full manner.