 ACME SMART PUBLICATION
- Books Name
- A TEXT OF BIOLOGY - CLASS XII
- Publication
- ACME SMART PUBLICATION
- Course
- CBSE Class 12
- Subject
- Biology
TWO GENES INTERACTION (w.r.t. Post-Mendelism)
Genes usually function or express themselves singly or individually.
But, many cases are known where two genes of the same allelic pair or genes of two or more different allelic pairs influence one another.
This is called gene interaction.
Non-allelic genetic interactions.
These are interactions between genes located on the same chromosome or on different but non-homologous chromosomes controlling a single phenotype to produce a different expression.
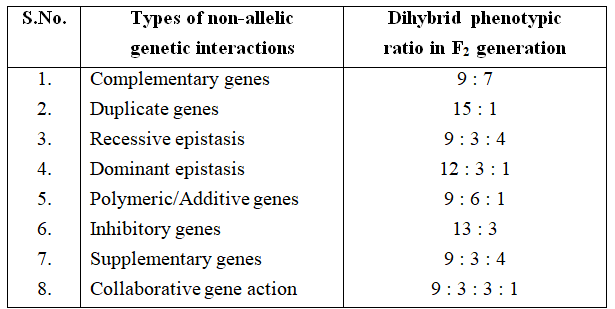
Each interaction is typical in itself and ratios obtained are different from those of the Mendelian dihybrid ratios.
Some of these interactions of genes are explained here which fall under this category and deviate from Mendel's ratios.
1. Complementary genes :
The complementary genes are two genes present on separate loci that interact together to produce dominant phenotypic character, neither of them if present alone, can express itself. It means that these genes are complementary to each other.
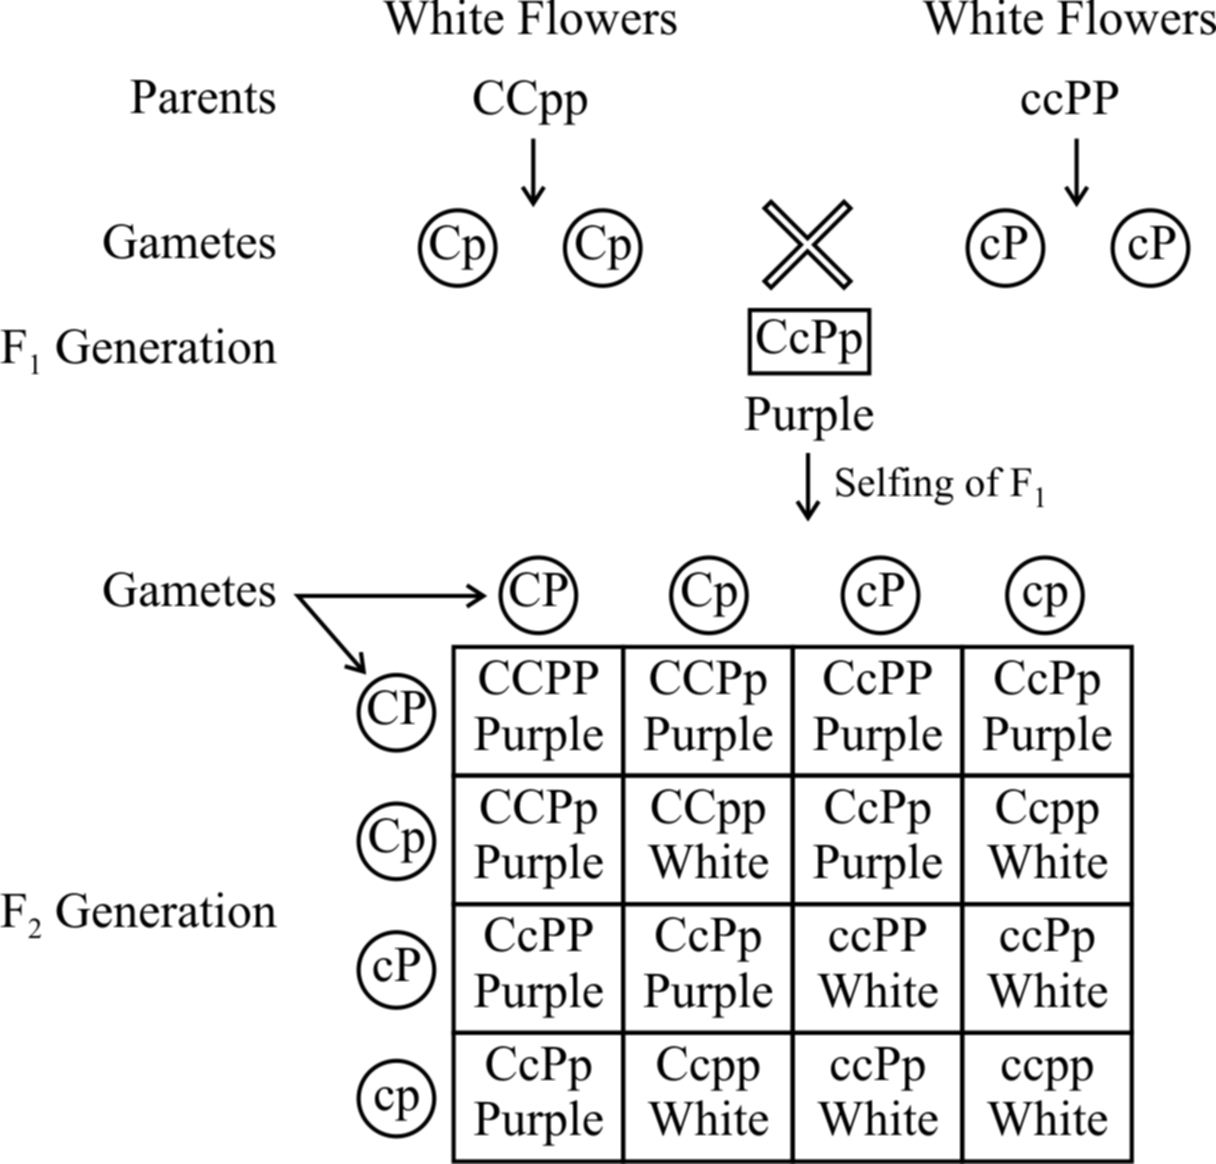
Fig. : Results of an experiment showing inheritance of flower colour in
Lathyrus odoratus controlled by complementary genes
Bateson and Punnet have demonstrated that in sweet pea (Lathyrus odoratus) purple colour of flowers develop as a result of interaction of two dominant genes C and P.
In the absence of dominant gene C or P or both, the flowers are white.
It is believed that gene C produces an enzyme that catalyzes the formation of necessary raw material for the synthesis of pigment anthocyanin and gene P produces an enzyme which transforms the raw material into the pigment.
It means the pigment anthocyanin is the product of two biochemical reactions, the end product of one reaction forms the substrate for the other.
![]()
Therefore, if a plant has ccPP, ccPp, CCpp or Ccpp genotypes, it bears only white flowers. Purple flowers are formed in plants having genotype CCPP or CCPp or CcPP or CcPp.
From checker board, it is clear that 9 : 7 ratio between purple and white is a modification of 9 : 3 : 3 : 1 ratio.
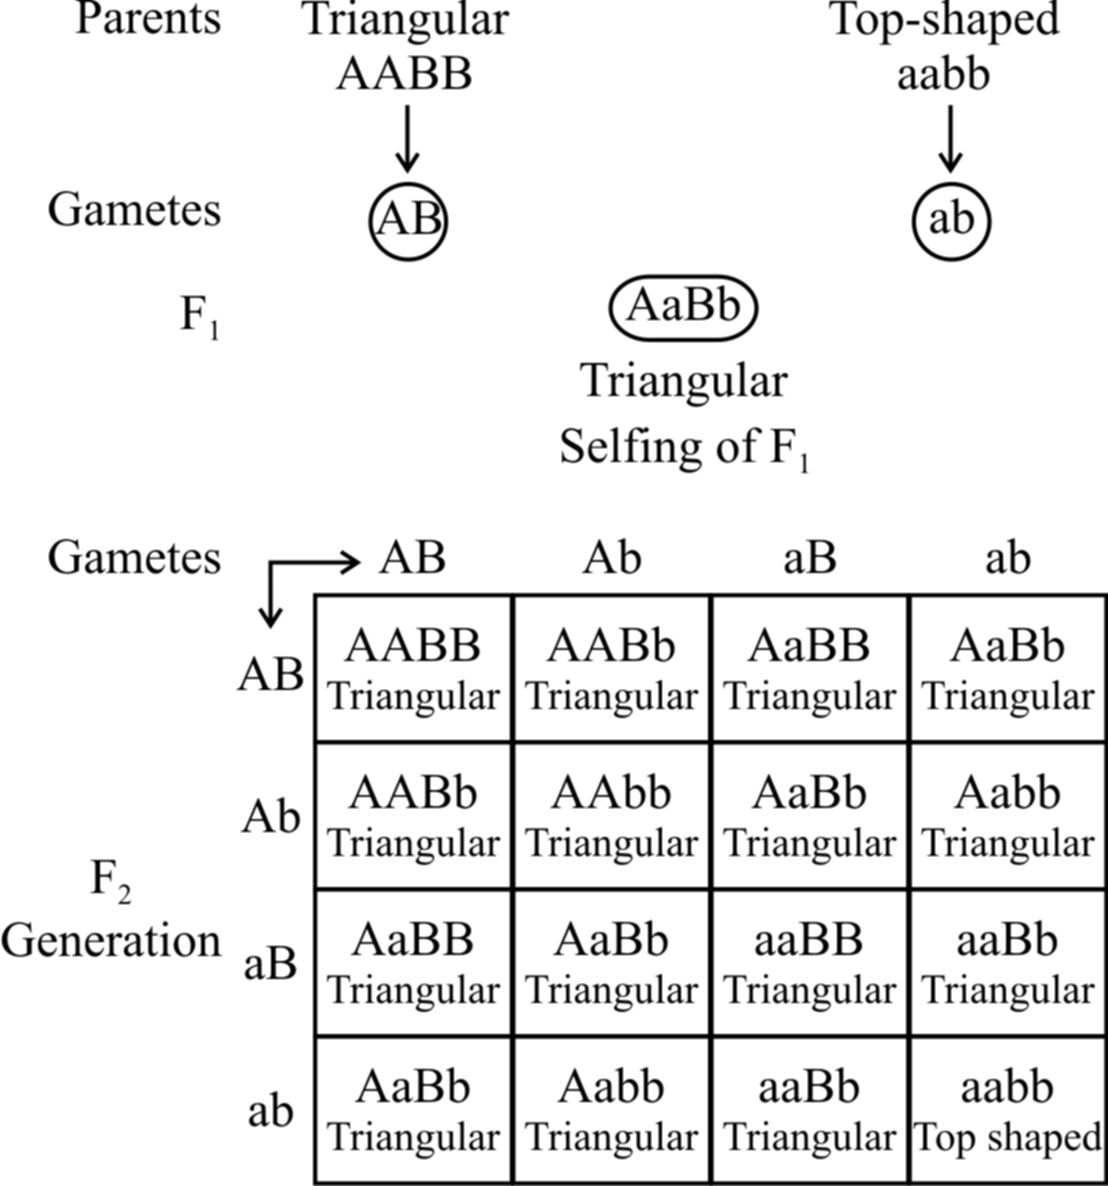
2. Duplicate genes.
If the dominant alleles of two gene loci produce the same phenotype, whether inherited together or separately, the 9 : 3 : 3 : 1 ratio is modified into a 15 : 1 ratio.
Example: The capsules of shepherd's purse (Capsella) occur in two different shapes, i.e., triangular and top-shaped. When a plant with triangular capsule is crossed with one having top-shaped capsule, in F1 only triangular character appears. The F1 offspring by self crossing produced the F2 generation with the triangular and top-shaped capsules in the ratio of 15 : 1. Two independently segregating dominant genes (A and B) have been found to influence the shape of capsule in the same way. All genotypes having dominant alleles of both or either of these genes (A and B) would produce plants with triangular-shaped capsules. Only those with the genotype aabb would produce plants with top shaped capsules. The results of this example are given below.
3. Epistasis
A gene which masks (hides) the action of another gene (non allelic) is termed as epistatic gene. The process is called epistasis. The gene whose effects are masked is called hypostatic gene.
Epistasis is of two types :
(a) Recessive epistasis :
Here the recessive allele in homozygous condition masks the effect of dominant allele, e.g., in mice, the wild body colour is known as agouti (greyish) and is controlled by a gene say A which is hypostatic to recessive allele c.
The dominant allele C in the presence of 'a' gives coloured mice.
In the presence of dominant allele C, A gives rise to agouti.
So, CCaa will be coloured and ccAA will be albino.
When coloured mice (CCaa) are crossed with albino (ccAA), agouti mice (CcAa) appear in F1.
cc masks the effect of AA and is therefore epistatic.
Consequently, cc AA is albino.
The ratio 9 : 3 : 3 : 1 is modified to 9 : 3 : 4.
The combination ccaa is also albino due to the absence of both the dominant alleles.
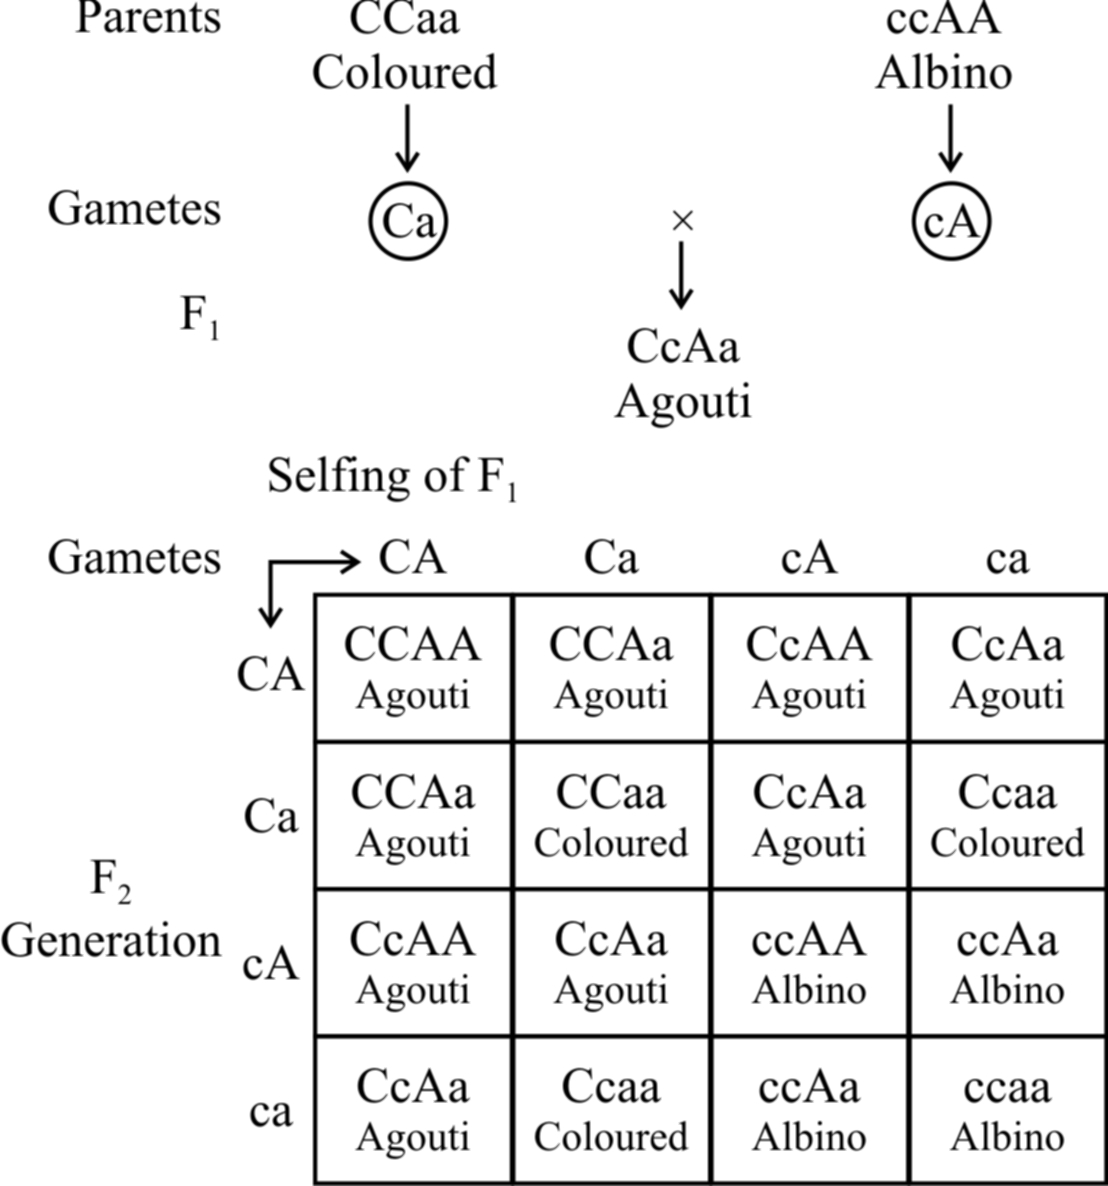
Fig. : Recessive epistasis
(b) Dominant epistasis :
In summer squash or Cucurbita pepo, there are three types of fruit colour -yellow, green and white.
White colour is dominant over other colours, while yellow is dominant over green.
Gene for white colour (W) masks the effects of yellow colour gene (Y).
So, yellow colour is formed only when the dominant epistatic gene is represented by its recessive allele (w). When the hypostatic gene is also recessive (y) , the colour of the fruit is green.
White Fruit – W – Y –, W – y –
Yellow Fruit – wwY –
Green Fruit – wwyy
A cross between a pure breeding white summer squash, (WWYY) with a pure breeding green summer squash, (wwyy) yields white fruits in the F1 generation. Upon selling of F1, the F2 generation comes to have 12 white fruit : 3 yellow fruit : 1 green fruit.
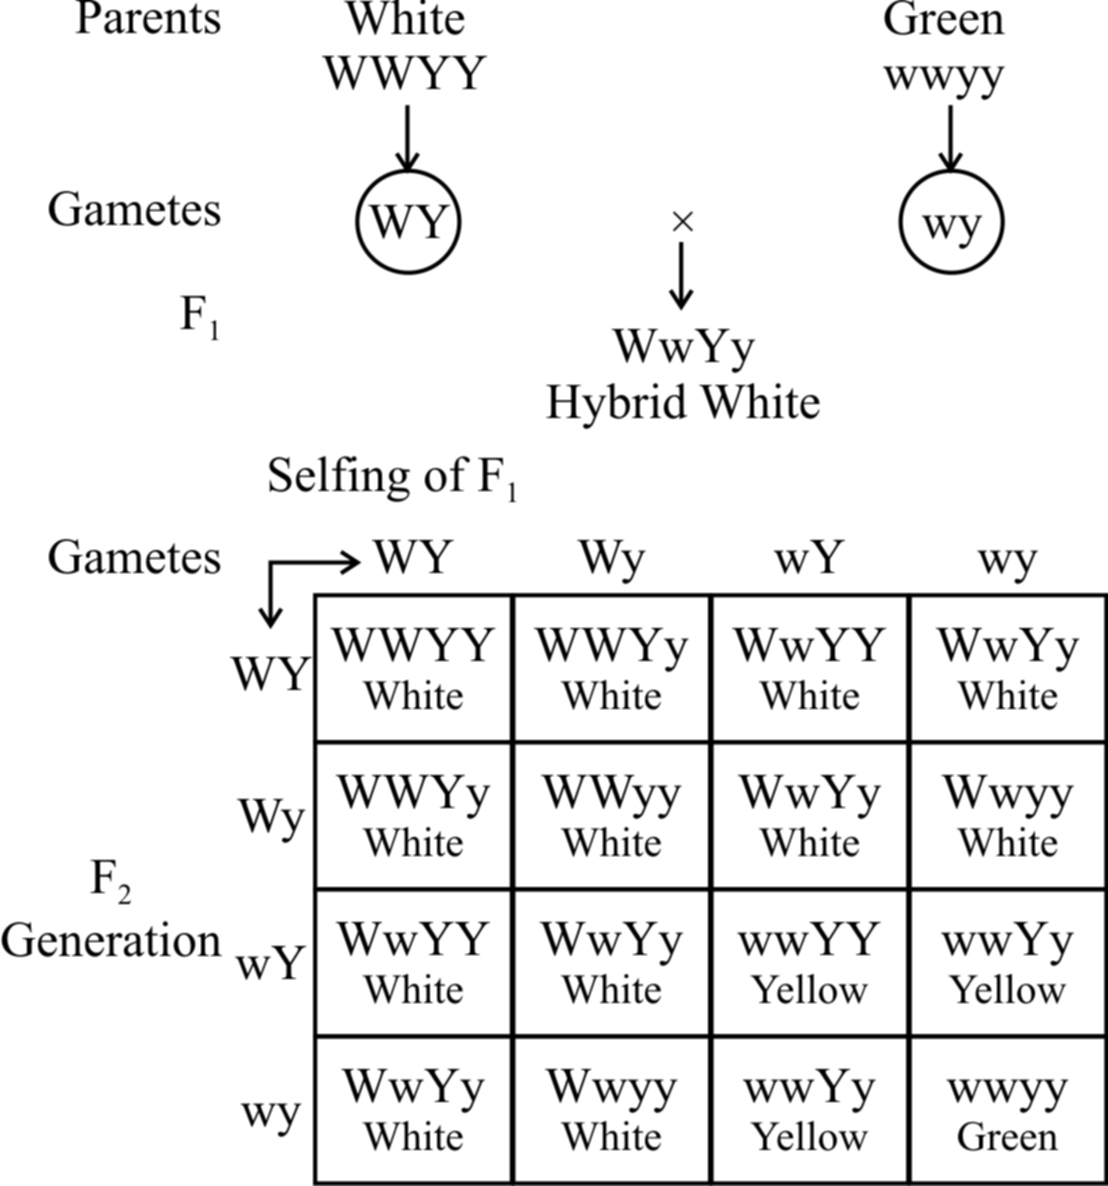
Fig. : Dominant epistasis
Polygenic inheritance or quantitative inheritance
Quantitative inheritance is controlled by two or more genes in which the dominant alleles have cumulative effect, with each dominant allele expressing a part of functional polypeptide and full trait is shown when all the dominant alleles are present.
Genes involved in quantitative inheritance are called polygenes.
H. Nilsson-Ehle (1908) and East (1910) demonstrated segregation and assortment of genes controlling quantitative traits, e.g., Kernel colour in wheat and corolla length in tobacco.
Kernel colour in wheat. Swedish geneticist, H. Nilsson-Ehle (1908) crossed red kerneled variety with white kerneled variety of wheat.
Grains of F1 were uniformly red but intermediate between the red and white of parental generation.
When members of F1 were self·crossed among themselves, five different phenotypic classes appeared in F2 showing the ratio of 1 : 4 : 6 : 4 : 1.
(i) The extreme red -1/16 (as red as to the parent of F1)
(ii) Deep red (Dark red) -4/16
(iii) Intermediate red -6/16 (similar to F1)
(iv) Light red -4/16
(v) White -1/16 (as white as to the parent of F1)
Nilsson Ehle found that the kernel colour in wheat is determined by two pairs of genes AA and BB.
Gene A and B determine the red colour of kernel and are dominant over their recessive alleles. Each gene pair shows Mendelian segregation.
Heterozygotes for two pairs of genes (AaBb) segregate into 15 red and one white kerneled plants.
But all the red kernels do not exhibit the same shade of redness.
The degree of redness was found to correspond with the number of dominant alleles.
Skin Colour in Man
The presence of melanin pigment in the skin determines the skin colour.
The amount of melanin developing in the individual is determined by three (two also) pairs of genes.
These genes are present at three different loci and each dominant gene is responsible for the synthesis of fixed amount of melanin.
The effect of all the genes is additive and the amount of melanin produced is always proportional to the number of dominant genes.
Subsequent studies after Davenport have shown that as many as six genes may be involved in controlling the skin colour in human beings.
As shown in table, the effect of all the genes is additive (The character is assumed to be fixed by three pairs of polygenes).
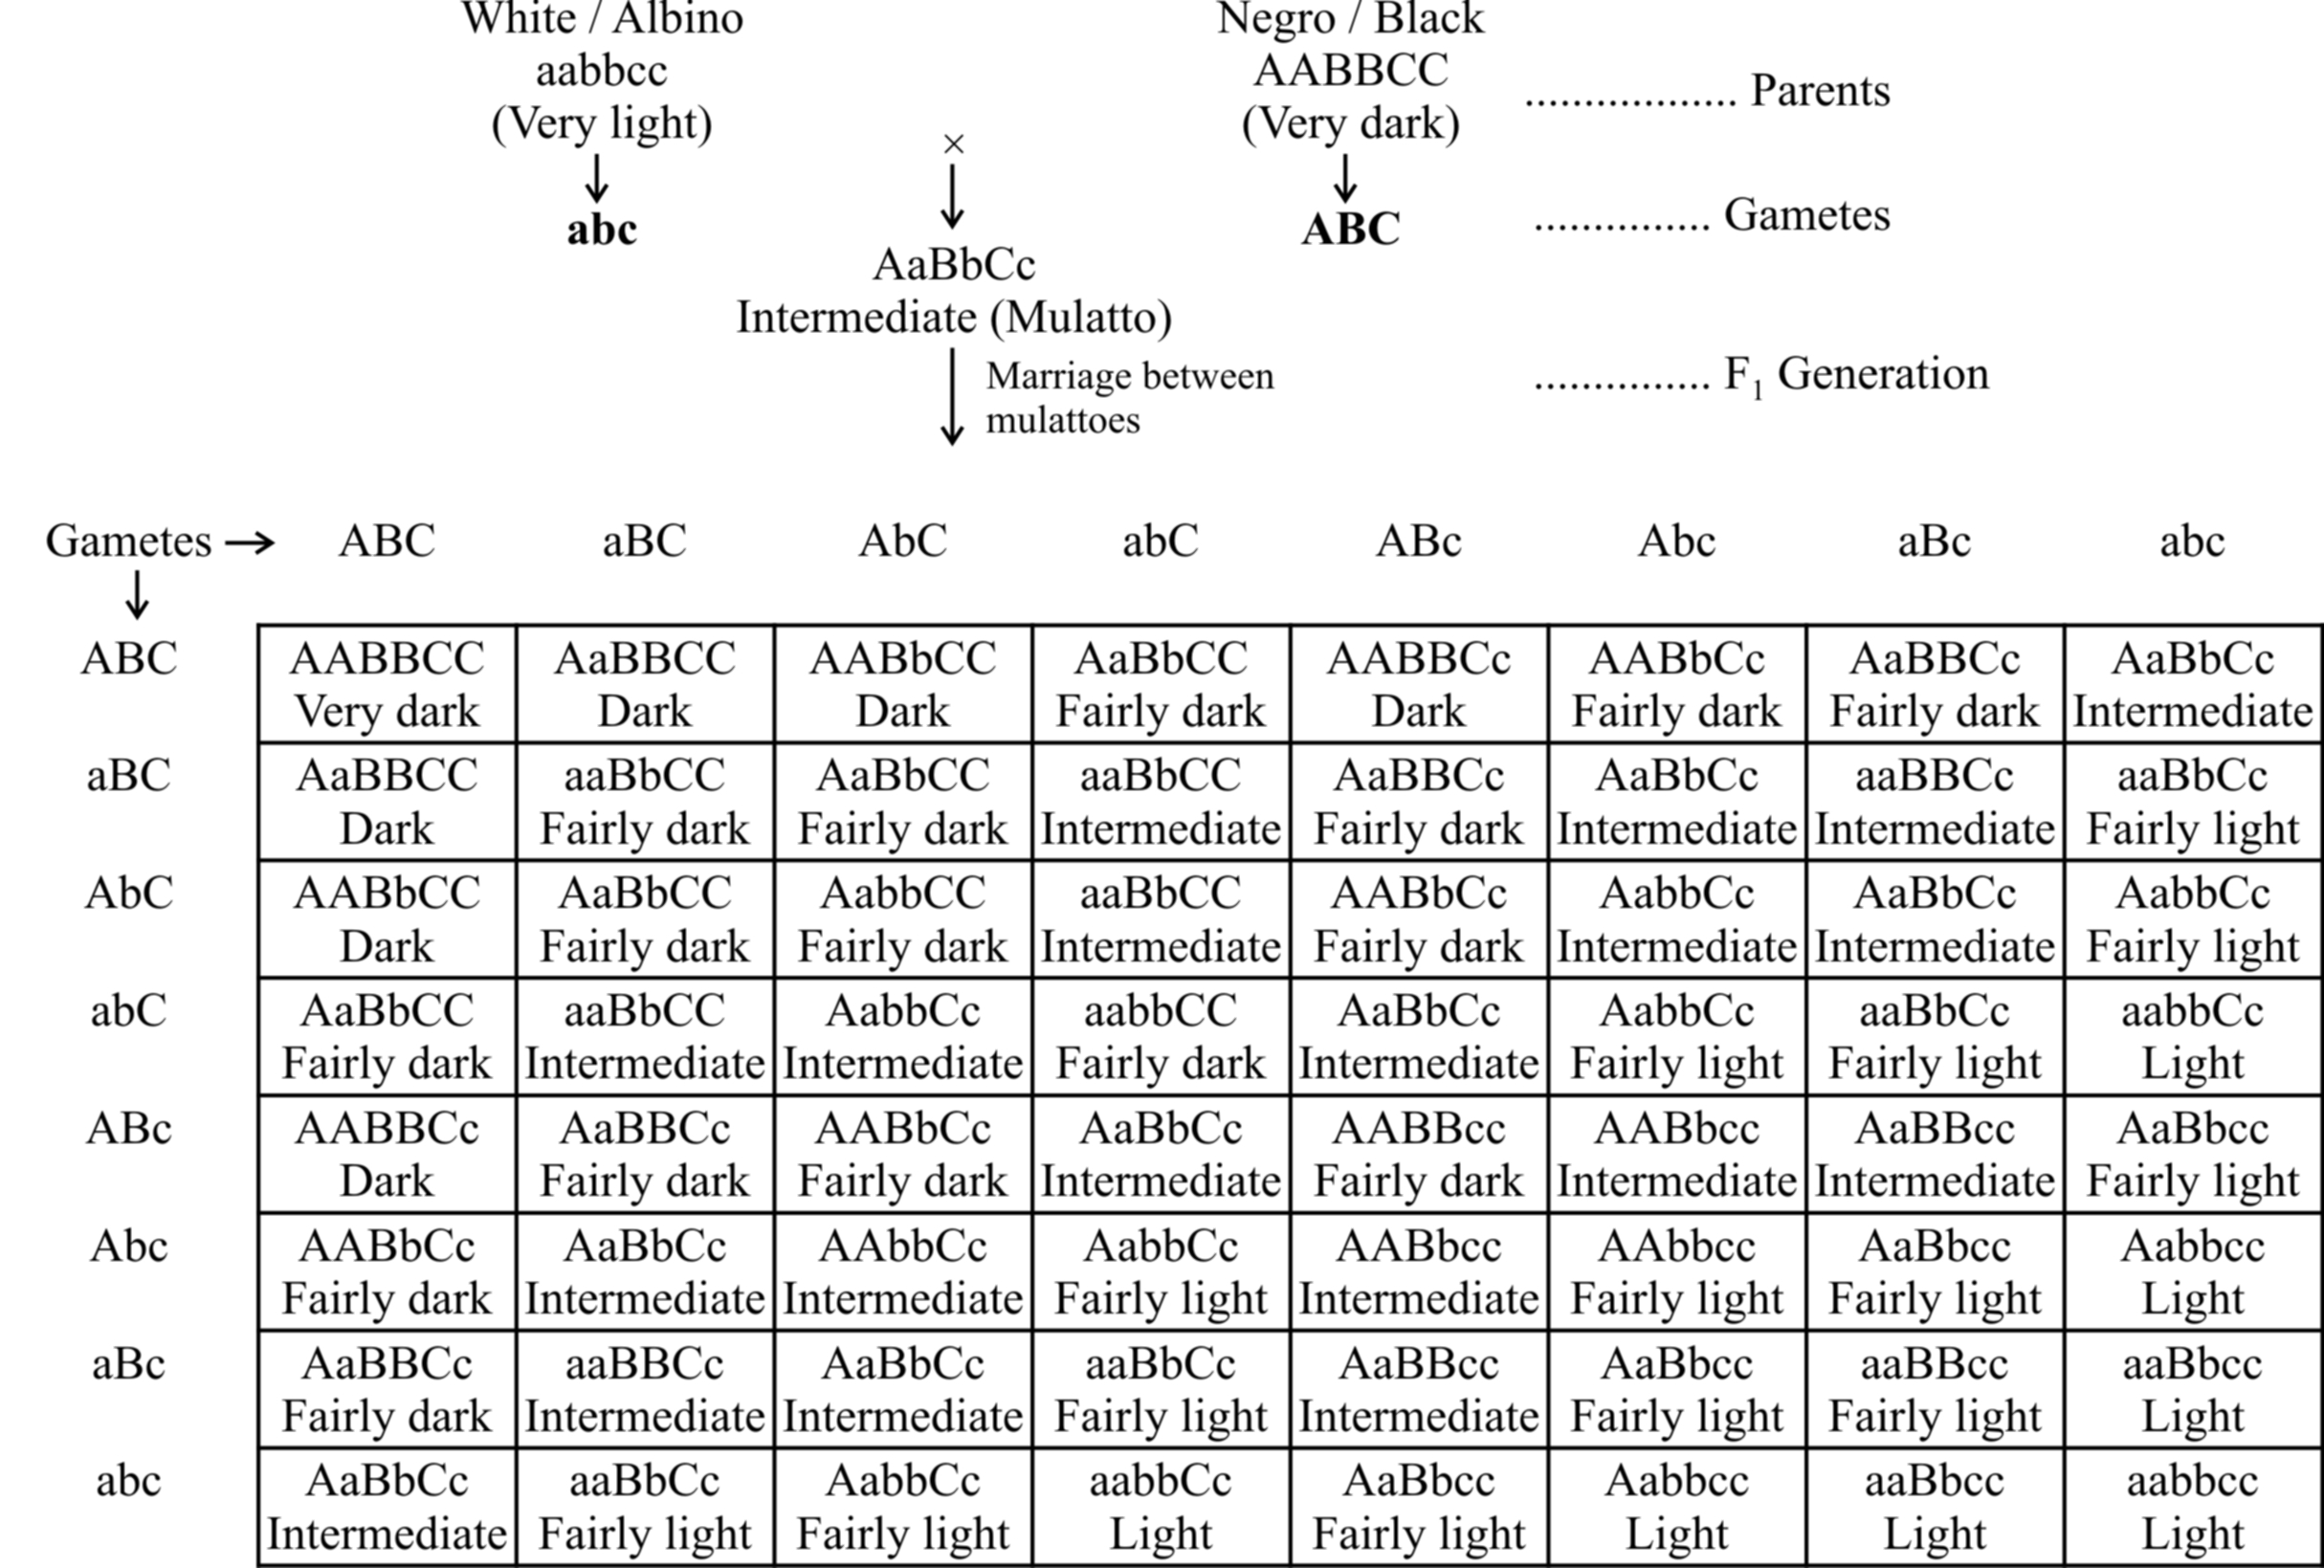
Phenotypes: 1 (Very dark) : 6 (Dark) : 15 (Fairly dark) : 20 (Intermediate) : 15 (Fairly light) : 6 (Light) : 1 (Very light)
The F1 progeny between an albino and a negro individual called mulatto produces intermediate skin colour.
In F2 generation, the coloured offsprings exhibit different shades in the ratio 1 : 6 : 15 : 20 : 15 : 6 : 1.
The frequency distribution for skin colour can be represented either as a histogram or in the form of a bell-shaped normal distribution curve.
Looking at the histogram, it can be concluded that in polygenic inheritance, the extreme phenotypes are rare and the intermediate ones are more frequent.
Some other example of quantitative traits are cob length in maize, human intelligence, milk and meat production, height in human and size, shape and number of seeds and fruits in plants.
- Number of phenotype for polygenes = 2n + 1
- Number of genotype for polygenes = 3n, where n represent pair of polygenes.
Example.7 : Calculate the sum total of phenotypes and genotypes in F2 generation if a character is controlled by 2 pair of polygenes.
Solution : Number of phenotype for polygenes = 2n + 1
(2 × 2 + 1) = 5
Number of genotype for polygenes = 3n
32 = 9
i.e., 5 + 9 =14
CHROMOSOMAL THEORY OF INHERITANCE / PARALLELISM BETWEEN
CHROMOSOMES AND MENDELIAN FACTORS
Chromosomal theory of inheritance was proposed independently by Sutton and Boveri.
The two workers found a close similarity between the transmission of hereditary traits and behaviour of chromosomes while passing from one generation to the next through the agency of gametes.
Sutton and Boveri noted that the behaviour of chromosomes is parallel to the behaviour of Mendelian factors (Genes).
The salient features of chromosomal theory of inheritance are as follows :
1. Like the hereditary traits the chromosomes retain their number, structure and individuality throughout the life of an organism and from generation to generation. The two neither get lost nor mixed up. They behave as units.
2. Both chromosomes as well as genes occur in pairs in the somatic or diploid cells. The two alleles of a gene pair are located on homologous sites on homologous chromosomes.
3. A gamete contains only one chromosome of a type and only one of the two alleles of a trait.
4. The paired condition of both chromosomes as well as Mendelian factors is restored during fertilization.
Homologous chromosomes synapse during meiosis and then separate or segregate independently into different cells which establishes the quantitative basis for segregation and independent assortment of hereditary factors.
Sutton united the knowledge of chromosomal segregation with Mendelian principles and called it the chromosomal theory of inheritance.
Johannsen (1909) coined the term gene, for mendelian factor.
Following the synthesis of ideas, experimental verification of the chromosomal theory of inheritance by T.H. Morgan and his colleagues, led to discovery of the basis for the variations, that sexual reproduction produced.
Thomas Hunt Morgan (1866-1945) is known as father of experimental genetics. He was awarded Nobel Prize of physiology in 1933 for his pioneer work in experimental genetics.
Drosophila melanogaster as material for experimental Genetics
Fruit fly Drosophila is a tiny fly of about 2 mm size which is found over ripe fruits like mango and banana.
The fly is actually attracted to yeast cells present on the surface of the ripe fruits. Drosophila is more suitable than pea as experimental material because of following reasons :
(i) It can be easily reared and bred under laboratory conditions.
(ii) The fly has a short life span of about two weeks. The fruit fly can be bred throughout the year so that numerous generations can be obtained in a single year instead of one as in case of Pea.
(iii) A single mating produces hundreds of offsprings.
(iv) Females are easily distinguishable from the males by the larger body size and presence of ovipositor (egg laying structure).
(v) The animal shows a number of externally visible and easily identifiable contrasting traits.
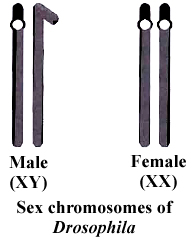
(vi) It has a smaller number (4 pairs) of morphologically distinct chromosomes.
(vii) Polytene chromosomes occur in the salivary glands of larva. Polytene chromosomes can be used to study different types of chromosome aberrations.
(viii) It has heteromorphic (XY) sex chromosomes in the male. The transmission of heteromorphic chromosomes can be easily studied from one generation to another.
LINKAGE (Exception to Law of Independent Assortment)
According to Mendel's law of independent assortment, the gene controlling different characters get assorted independent to each other.
It is correct if the genes are present on two different chromosomes, but if these genes are present on same chromosome they may or may not show independent assortment.
If crossing over takes place between these two genes then the genes get segregated and they will assort independent to each other. But if there is no crossing over between these two genes there is no segregation, hence only parental combination will be found in gametes.
The tendency of some of the genes to inherit together (in block) is known as linkage.
In 1906, Bateson and Punnet crossed two varieties of Lathyrus odoratus (sweet pea) and observed that the results do not agree with the Mendel's law of independent assortment.
They formulated the hypothesis of coupling and repulsion to explain the unexpected F2 results of dihybrid cross between a homozygous sweet pea having dominant alleles for blue flowers (BB) and long pollen grains (LL) with another homozygous double recessive plant with red flowers and round pollen grains (bbll).
Test cross ratio of 7 : 1 : 1 : 7 indicated that there was a tendency of the dominant alleles to remain together. Similar was the case with recessive alleles.
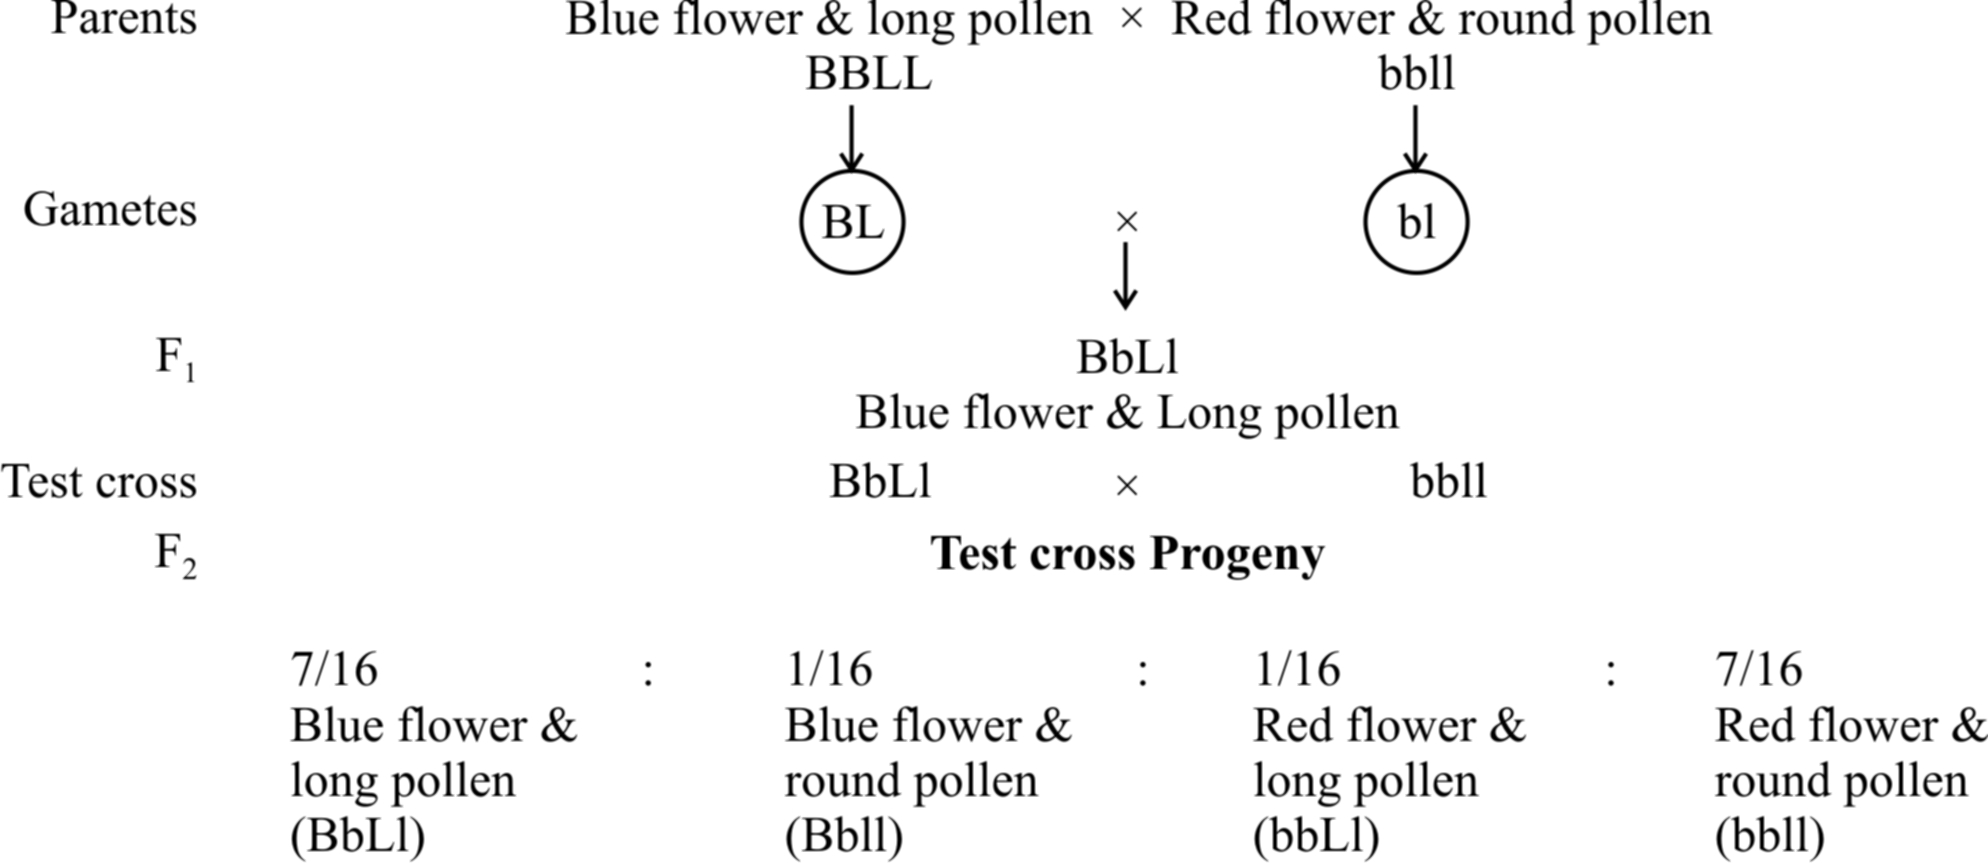
It was called gametic coupling by Bateson and Punnet.
Two dominant genes from one parent entered the same zygote more frequently than expected.
The tendency of two dominant genes to remain together in the process of inheritance was called as coupling.
In another cross, they took a sweet pea plant with blue flowers and round pollens (BBII) and other plant with red flowers and long pollens (bbLL) and obtained the ratio of 1 : 7 : 7 : 1 by test crossing F1 generation.

When two dominant or recessive genes come from different parents, they tend to remain separate hence, this ratio was called repulsion ratio.
T.H. Morgan in 1910 showed that coupling and repulsion are two aspects of the same phenomenon called linkage.
He suggested that the two genes present on the same chromosome, are in coupling phase and when present on two different homologous chromosomes are in repulsion phase.
Morgan carried out several dihybrid crosses in Drosophila to study genes that were sex-linked and
(A) At first, he crossed yellow bodied (y) and white eyed (w) female with brown bodied (y+) red eyed (w+) male which produced F1 with brown bodied red eyed female and yellow bodied white eyed male. In F2 generation, obtained by intercrossing of F1 hybrids, the ratio deviated significantly from expected. He found 98.7% to be parental and 1.3% as recombinants.
(B) In a second cross between white eyed and miniature winged female (wwmm) with wild red eyed (w+) normal winged male (m+), the F1 generation included red eyed normal winged female and white eyed miniature winged male. After intercrossing the F1 progeny, he found 62.8% parental and 37.2% recombinants.
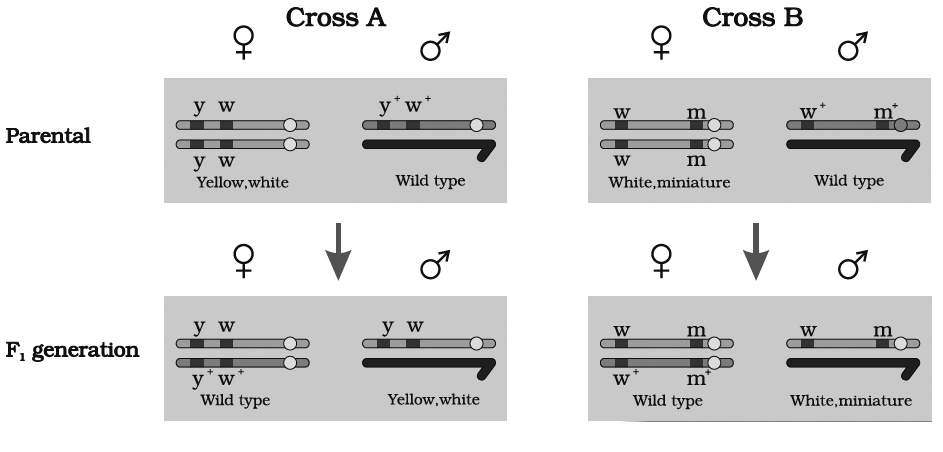
we can say that strength of linkage between y and w is higher than w and m
According to Morgan, the degree or the strength of linkage depends upon the distance between the linked genes in the chromosome.
Linkage, therefore, may be defined as "The tendency of two genes of the same chromosome to remain together in the process of inheritance".
Kinds of Linkage
T.H. Morgan and his coworkers found two types of linkage :
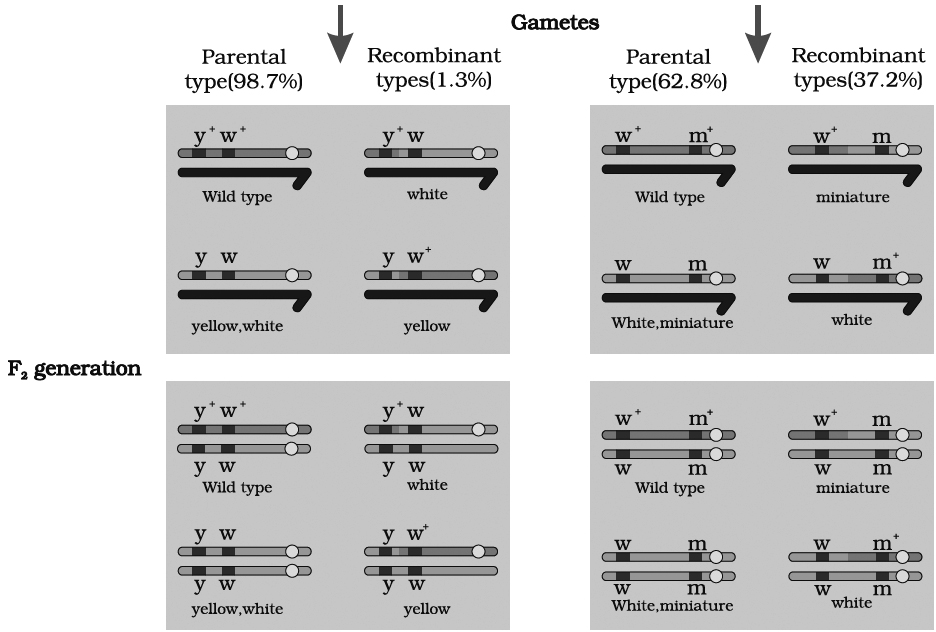
(1) Complete linkage.
Linkage of genes on a chromosome which is not altered and is inherited as such from generation to generation without any cross over.
In this type of linkage, genes are closely associated and tend to remain together.
Example: Male Drosophila and female silk worm (Bombax mort).
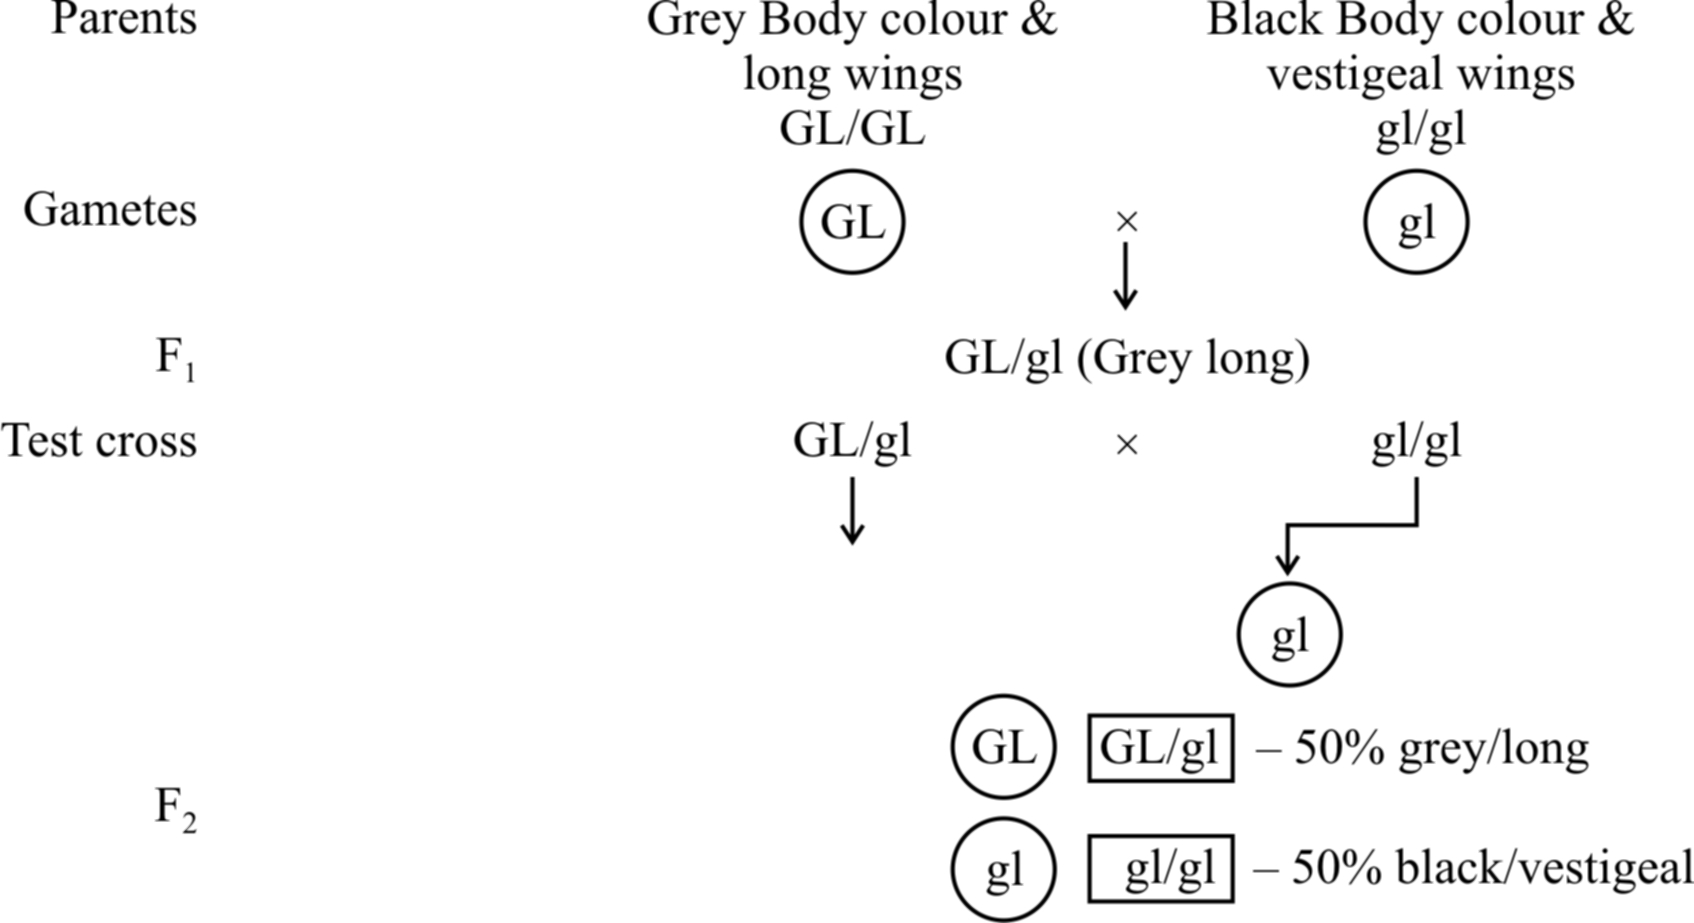
100% parental combinations indicated that the gene for grey body colour is completely linked with long wings.
In this dihybrid, F2 phenotypic ratio is 3: 1 and test cross ratio is 1 : 1 (like a monohybrid). Another example is inheritance of red eye and normal wing (PV/PV) with purple eye and vestigial wing character (pv/pv).
(2) Incomplete linkage.
The linked genes do not always stay together because homologous non sister chromatids may exchange segments of varying length with one another during meiosis.
This is known as crossing over.
The linked genes may have chances of separation by crossing over, are called incompletely linked genes and the phenomenon of their inheritance is called incomplete linkage.
It produces both parental and recombinant types in variable ratio.
Bateson and Punnet studied Lathyrus odoratus and defined coupling and repulsion of dominant and recessive gene.
In cis arrangement or coupling condition, the incomplete linkage ratio was 7 : 1 : 1 : 7 (14-parental 2-recombinants).
In trans arrangement or repulsion case, the ratio was 1:7:7:1 (parental 14, recombinants = 2).
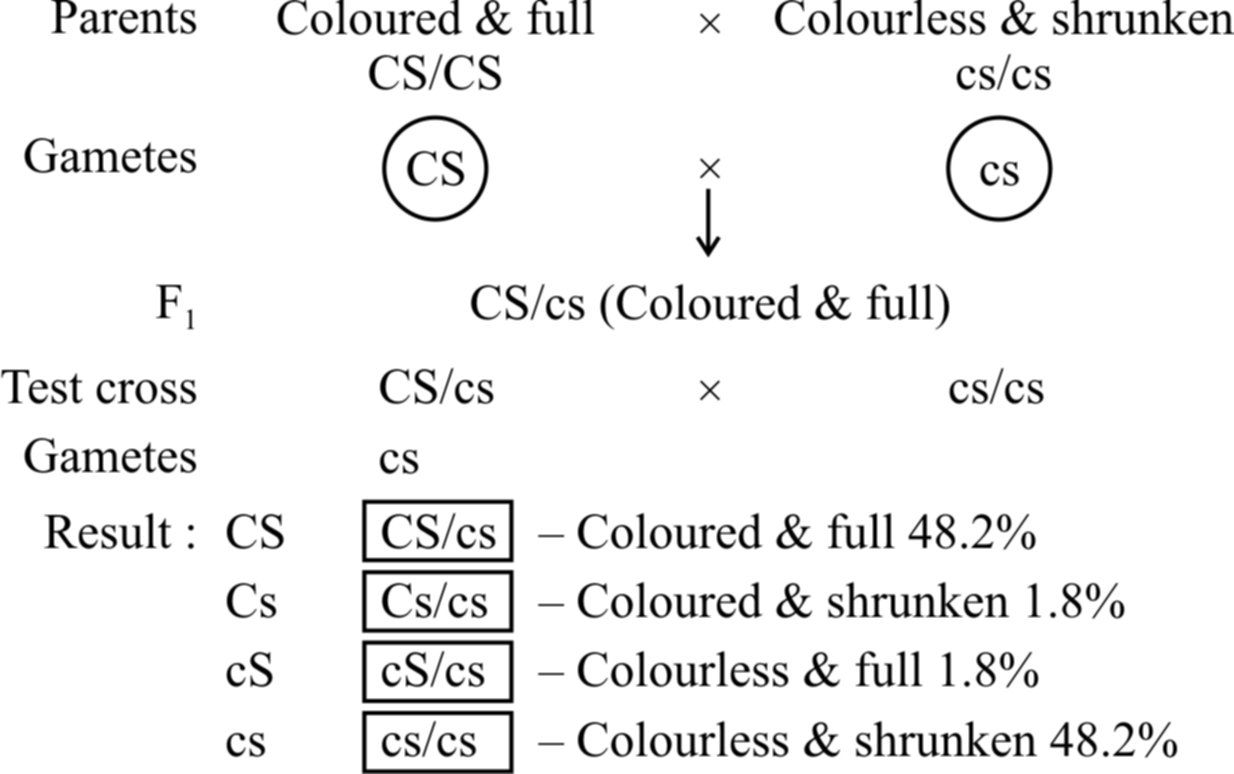
Example: In maize, incomplete linkage was observed by Hutchinson w.r.t seed coat colour and seed shape. The results show that parental combination of alleles (CS/CS and cs/cs) appear in about 96% cases. The other two are new combinations (Cs/cs and cS/cs) wh ich appear in about 4% cases. Thus, in about 4% cases, crossing over has occurred between linked genes.
Concept Builder
Linkage Group
A set of genes on a chromosome that tend to be inherited (transmitted) which can inherit together from one generation to another generation, constitute a linkage group.
Number of linkage group in an organism is equal to 'n' number of chromosome, e.g., it is 12 in rice, 7 in Pisum, while in human beings, the number of linkage group is 23 in human female and 24 in human male and in Drosophila it is 4.
CROSSING OVER AND RECOMBINATION
Crossing over is a process that produces new combination of genes by interchanging of segments between nonsister chromatids of homologous chromosomes.
The crossing over occurs in between the homologous chromosomes at four stranded or tetrad stage during pachytene of prophase I of Meiosis I.
A condition where an individual heterozygous for two pairs of linked genes (AaBb) possesses the two dominant genes on one member of the chromosome pair and the two recessive on the other, is said to be cis arrangement.
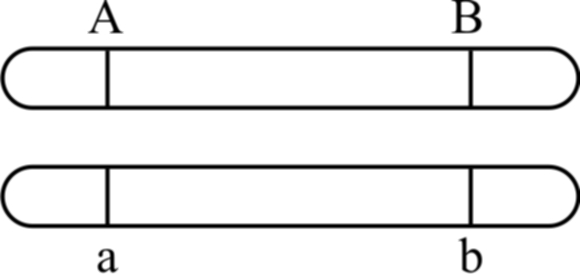
Cis arrangement
If an individual heterozygous for two pairs of linked genes (AaBb) possesses one dominant and one recessive allele of each pair of genes on each member of the homologous pair of chromosome, the arrangement is said to be Trans arrangement.
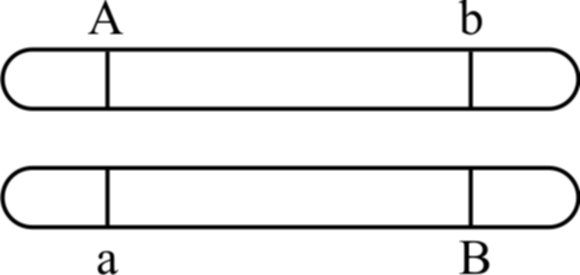
Trans arrangement
When two genes are located very close to each other in chromosomes, hardly any crossing over can be detected.
The linkage is broken down due to crossing over.
Crossing over will be relatively more frequent if the distance between two genes is more.
Frequency of crossing over can be determined cytologically by counting the number of chiasmata.
The details of the crossing over for two genes A and B and their alleles a and b on the homologous chromosomes are shown in figure.
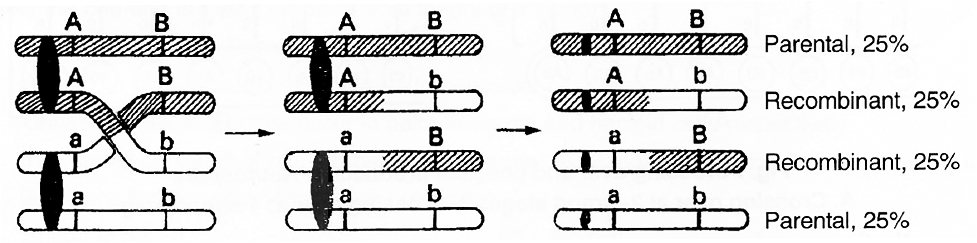
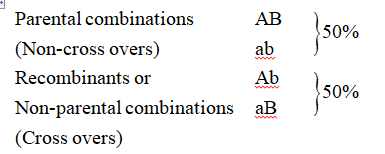
Fig. : Crossing over showing 50 per cent parental and 50 percent recombinants
The crossing over as shown above results in the formation of following four types of cells :
Crossing Over Occurs at Four Stranded Stage
Neurospora (pink mould), an ascomycetous fungus is used to demonstrate that crossing over takes place at 4-stranded stage.
It has following advantages as experimental organism :
(1) It is haploid and there is only one allele at each locus. Hence, dominant-recessive relationship does not interfere with observations and analysis.
(2) The products of single meiosis can be easily analysed.
(3) The products of meiosis occur in the form of 'ordered tetrads', i.e., the eight ascospores formed, are linearly arranged in a sac-like structure called ascus.
If genes A and B are located on same chromosome and undergo independent assortment, the genotype of linearly arranged ascospores can be studied. If crossing over takes place at 2-strand stage, the ascospores would show Ab, Ab, Ab, Ab, aB, aB, aB, aB, (4 Ab + 4 aB) arrangement.
If crossing over takes place at 4-stranded stage, the ascospores would show AB, AB, Ab, Ab, aB aB, ab, ab, (2AB + 2 Ab + 2 aB + 2 ab) arrangement or 2: 4 : 2 arrangement.
Tetrad analysis has demonstrated the presence of such an arrangement and thus, it is now confirmed that crossing over occurs at 4-stranded stage.
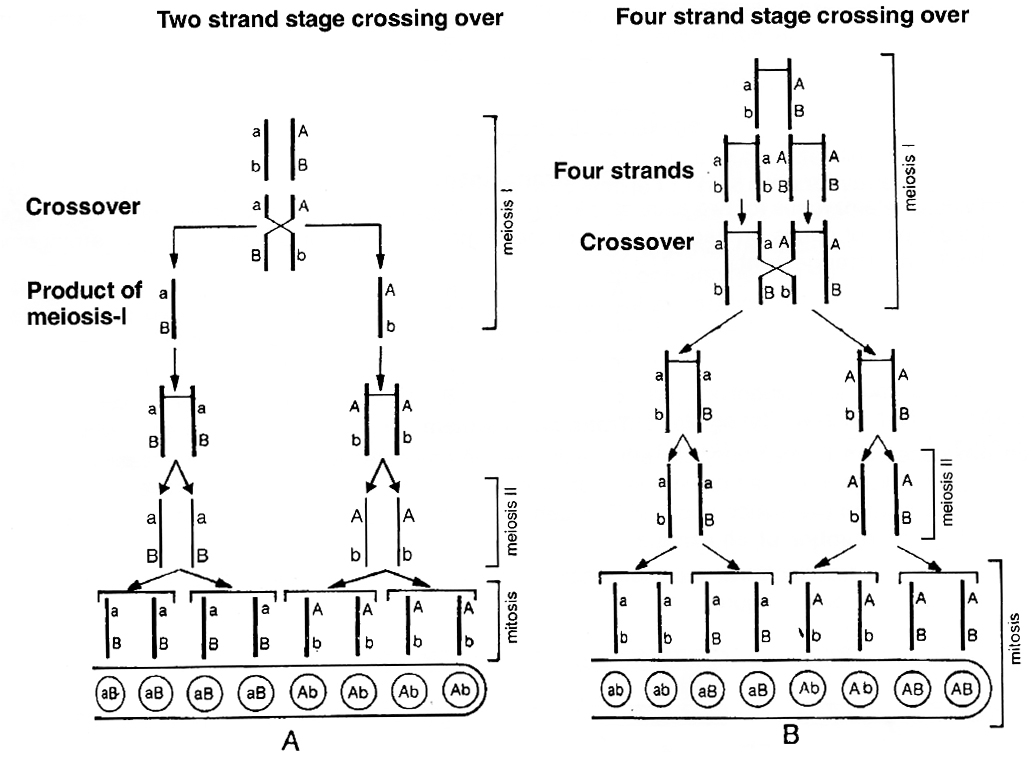
A. Crossing over at 2-strand stage; B. Crossing over at 4-strand stage
Factors affecting crossing over:
(i) Distance between the genes is directly proportional to crossing over.
(ii) Cross over decreases with age.
(iii) X-rays and temperature increases crossing over.
(iv) Centromere and heterochromatin positions decrease crossing over.
(v) One cross over reduces the frequency of other crossover in its vicinity which is called as interference.
Chromosomal Mapping
Crossing over is important in locating the genes on chromosome.
The genes are arranged linearly on the chromosome.
This sequence and the relative distances between various genes is graphically represented in terms of recombination frequencies or cross over values (COV).
This is known as linkage map of chromosome.
Distance or cross over units are called centimorgan (cM) or map unit.
Term centimorgan is used in eukaryotic genetics and map unit in prokaryotic genetics.
Recombination frequency or cross over value = 
The recombination frequency depends upon the distance between the genes.
If the distance between the genes is lesser the chances of crossing over is less and hence recombination frequency is also lesser and vice versa.
So, recombination frequency is directly proportional to the distance between genes.
In any cross, if recombination frequency is 5%.
It means the distance between the genes is 5 map unit.
A.H. Sturtevant suggested that these recombination frequencies can be utilized in predicting the sequence of genes on the chromosome.
On the basis of recombination frequency, he prepared first chromosomal map or genetic map for Drosophila.
Concept Builder
1. T.H. Morgan (1910) developed the theory of the gene as a locus or discrete unit on the chromosomes from his studies on Drosophila melanogaster.
2. Stern (1931) showed that genetic crossing over was accompanied with actual exchange of chromosome segments. He, therefore, gave the cytological proof of crossing over.
3. Map unit is related with frequency of crossing over and not with linkage.
4. C.D. Darlington -Precocity theory of crossing over.
5. J. Belling -Belling's hypothesis and copy choice mechanism of crossing over.
6. Creighton and McClintock -Cytological evidence of crossing over using corn as the material.
7. Pontecarvo (1952) -Defined genes as the ultimate unit of recombination.
8. Janssen -Discovered Chiasmata formation.
