 KRISHNA PUBLICATIONS
- Books Name
- AMARENDRA PATTANAYAK Mathmatics Book
- Publication
- KRISHNA PUBLICATIONS
- Course
- CBSE Class 11
- Subject
- Mathmatics
Graphical methods and Solution of Linear Inequalities in Two Variables
Graph of Linear inequalities in Two Variable
A linear equation in two variable is of the form
ax+by+c=0
We have already studied in Coordinate geometry that this can be represented by a straight line in xy- plane. All the points on the straight line are the solutions of this linear equation.
we can similarly find the solution set graphically for the linear inequalities in the below form
ax+by+c<0
ax+by+c>0
ax+by+c≥0
ax+by+c≤0
How to find the solution graphically for Linear inequalities in Two Variable.:
- Draw the graph of the equation obtained for the given inequality by replacing the inequality sign with an equal sign.
ax+by+c=0
- This can be done easily by Point on the x-axis( x,0) and point on the y axis ( 0,y)
- Point on x-axis given by ax+b(0)+c=0 or x=−c/a or (−c/a,0)
- Point on y-axis given by a(0)+by+c=0 or y=−c/b or (0,−c/b)
- Locate these point on cartesian plane and join them to find the line
- Use a dashed or dotted line if the problem involves a strict inequality, < or >.
- Otherwise, use a solid line to indicate that the line itself constitutes part of the solution.
- Pick a point lying in one of the half-planes determined by the line sketched in step 1 and substitute the values of x and y into the given inequality.
Use the origin whenever possible. - If the inequality is satisfied, the graph of the inequality includes the half-plane containing the test point.
Otherwise, the solution includes the half-plane not containing the test point
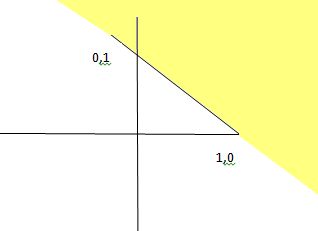
Example
Determine the solution set for the inequality
x+y>1
Solution
1) Draw the graph of the equation obtained for the given inequality by replacing the inequality sign with an equal sign.
i.e x+y=1
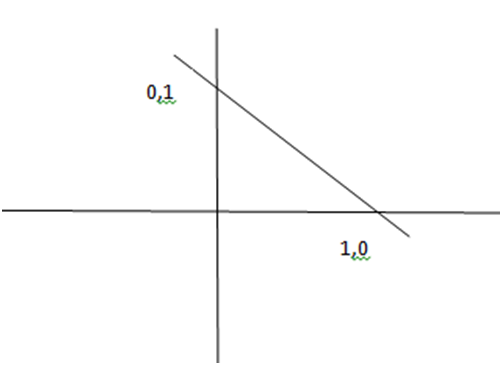
2) Pick the test point as origin (0,0), and put into the inequality
0+0>1
0>1
Which is false
So the solution set is other half plane of the line
How to find the solution graphically for pair of Linear inequalities in Two Variable.
ax+by+c<0
px+qy+c<0
The solution set of a system of linear inequalities in two variables x and y is the set of all points (x, y) that satisfy each inequality of the system.
Step
- Find the graphical solution for each inequality independently using the technique described above
- Now determine the region in common with each solution set
Example
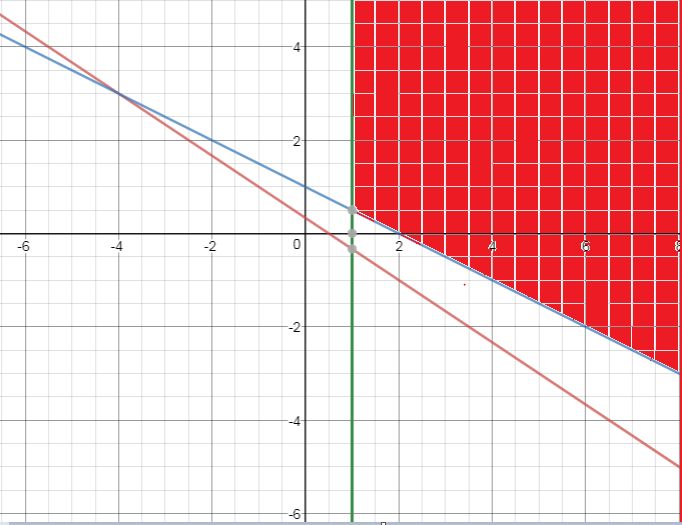
Find the solution of the below system of inequalities
2x+3y>1
x+2y>2
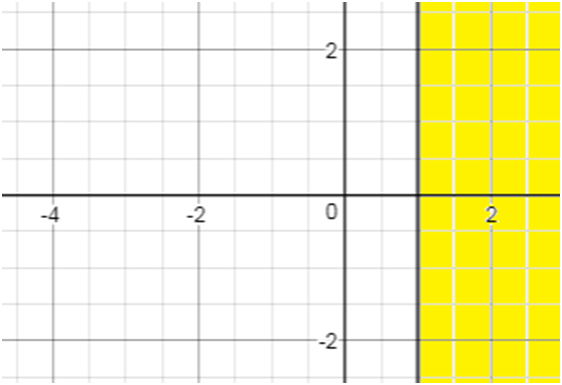
x>1
Solution
1) for 2x+3y>1, Solving using the above method solution is
2) for x+2y>2, Solving using the above method solution is
3) for x>1, Solving using the above method solution is
4) Now we draw these on the single graph and can determine the common region
Example:
Solve the following system of inequalities
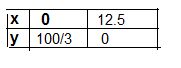
8x + 3y £ 100 ......... (1)
x ³ 0 ......... (2)
y ³ 0 ... …. (3)
Ans:
Let 8x + 3y = 100
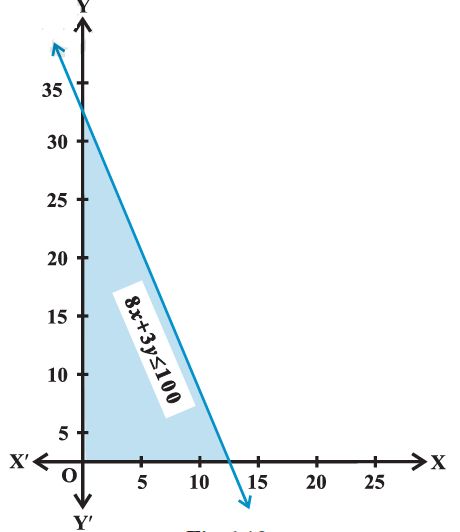
The inequality 8x + 3y £ 100 represents the shaded region below the line, including the
points on the line 8x +3y =100.
Since x ³ 0, y ³ 0, every point in the shaded region in the first quadrant, including the points on the line and the axes, represents the solution of the given system of inequalities.
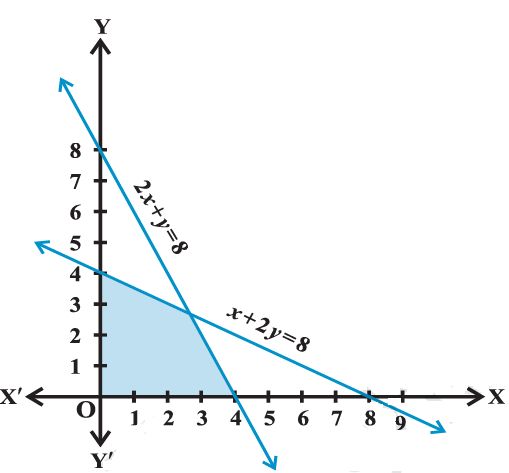
Question: Solve the following system of inequalities graphically
x + 2y £ 8 ... (1)
2x + y £ 8 ... (2)
x > 0 ... (3)
y > 0 ... (4)
Solution:
We draw the graphs of the lines
x + 2y = 8
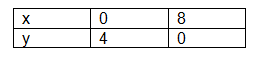
and
2x + y = 8.
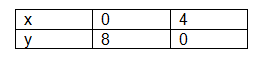
The inequality (1) and (2) represent the region below the two lines, including the point on the respective lines.
Since x ³ 0, y ³ 0, every point in the shaded region in the first quadrant represent
a solution of the given system of inequalities.
Note:
1 The region containing all the solutions of an inequality is called thesolution region.
2. In order to identify the half plane represented by an inequality, it is just sufficient to take any point (a, b) (not online) and check whether it satisfies the inequality or not. If it satisfies, then the inequality represents the half plane and shade the region which contains the point, otherwise, the inequality represents that half plane which does not contain the point within it. For convenience, the point (0, 0) is preferred.
3. If an inequality is of the type ax + by ³ c or ax + by £ c, then the points on the line ax + by = c are also included in the solution region. So draw a dark line in the solution region.
4. If an inequality is of the form ax + by > c or ax + by < c, then the points on the line ax + by = c are not to be included in the solution region. So draw a broken ordotted line in the solution region.
Example: Solve – 8 £ 5x – 3 < 7.
Solution : In this case, we have two inequalities,
– 8 £ 5x – 3 and 5x – 3 < 7,
which we will solve simultaneously.
We have – 8 £ 5x –3 < 7
or –5 £ 5x < 10 or –1 £ x < 2
Example:
A manufacturer has 600 litres of a 12% solution of acid. How many litres
of a 30% acid solution must be added to it so that acid content in the resulting mixture
will be more than 15% but less than 18%?
Solution: Let x litres of 30% acid solution is required to be added. Then
Total mixture = (x + 600) litres

