 ACERISE INDIA
Mean Of Grouped Data Using The Direct Method
A cricket player played 7 matches and scored 88, 72, 90, 94, 56, 62, and 76 runs. What is the average score or mean score of the player in these 7 matches?
We know that,
“The mean is the sum of all observations divided by the number of observations”.
We can use the following formula to find the mean of the given data.
Using this formula, the mean of scores obtained by the player
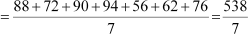 = 76.86
Thus, the average score of the player is 76.86. There are many situations where the number of observations is very large and then it is not possible to use this formula to find the mean of the given data.
Let us consider such a situation.
We have the marks distribution of 100 students of a class in a Mathematics test. The
distribution is given in the form of groups like 0 − 10, 10 − 20 …. To find the mean in such situations, we follow another method.
Example 1: The following table shows the various income brackets of the employees of a company.
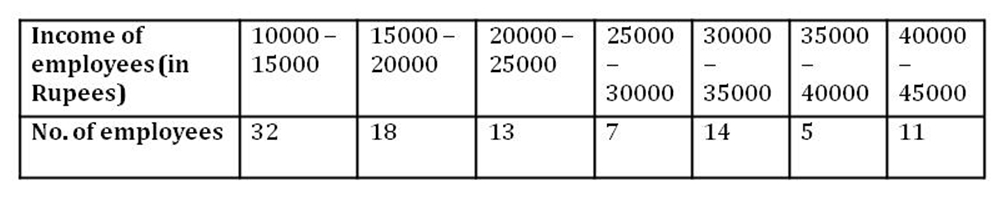
Find the average monthly income of each employee.
Solution:
Firstly, we will calculate the class marks of each class interval and then the product of the class marks with the corresponding frequencies. By doing so, we obtain the following table.
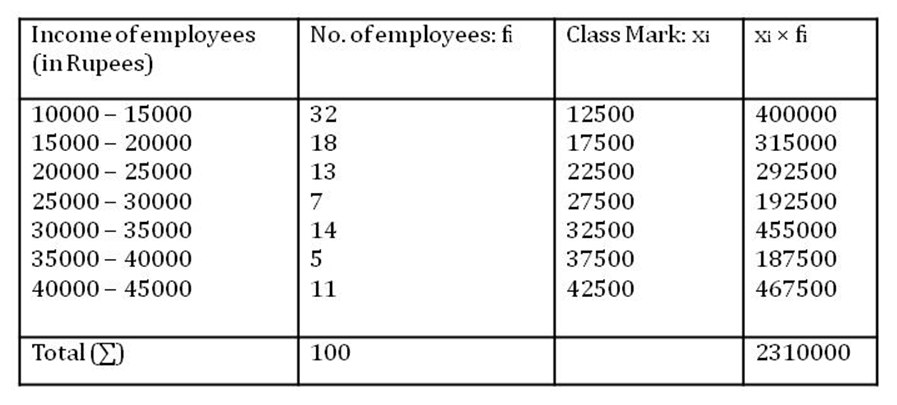
The mean can now be easily calculated using the formula.
Mean 
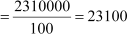
Hence, the average income of the employees is Rs 23100.
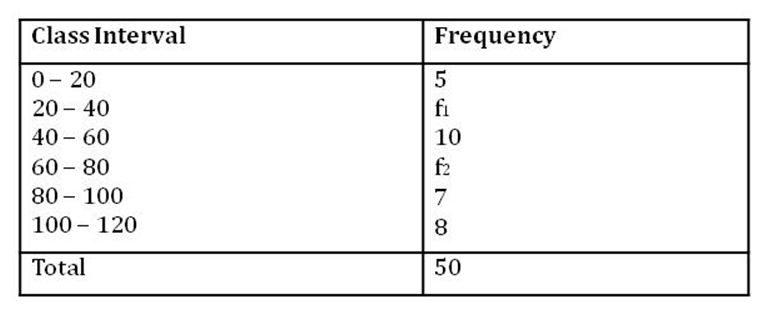
Example 2: The mean of the following frequency distribution is 62.8 and the sum of all the frequencies is 50. Find the value of f1 and f2.
Solution:
Firstly, let us find the class marks of each class interval and then the product of class marks with the corresponding frequencies for each class interval as shown in the following table.
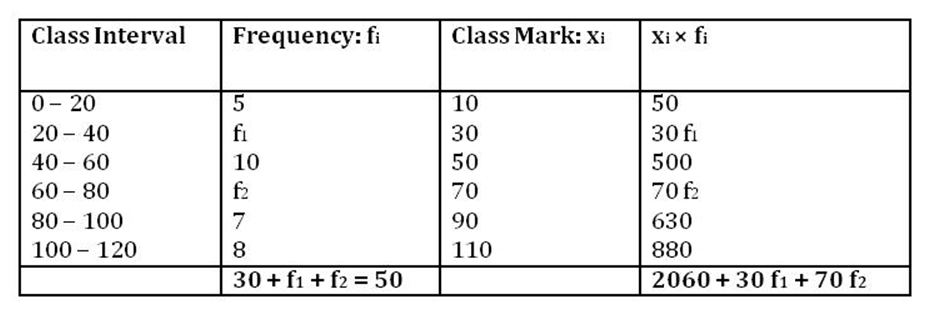
It is given that the sum of the frequencies is 50.
∴ 30 + f1 + f2 = 50
f1 + f2 = 20
f1 = 20 − f2 … (1)
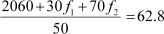
The mean is given as 62.8.
∴  = 62.8


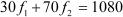
Using equation (1),
30(20 − f2) + 70 f2 = 1080
600 + 40 f2 = 1080
40 f2 = 1080 − 600 = 480
f2 =
On putting the value of f2 in equation (1), we obtain
f1 = 20 − f2 = 20 − 12 = 8
Thus, the values of f1 and f2 are 8 and 12 respectively.
Mean Of Grouped Data Using Assumed Mean Method
We know that direct method can be used to find the mean of any data given in grouped form, but the calculation in direct method becomes very tough when the data is given in the form of large numbers, because finding the product of xi and fi becomes difficult and time consuming.
Therefore, we introduce assumed mean method to find the mean of grouped data. This method is also known as shift of origin method. This is an easier method to find the mean as it involves less calculation.
Example 1: The following table shows the life time (in hours) of 20 bulbs manufactured by a reputed company.
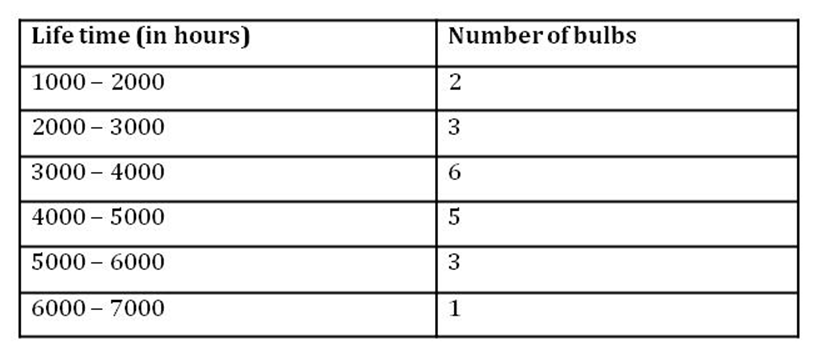
Find the average life time of a bulb in hours. Solution:
Firstly, we calculate the class mark of each class-interval and assume one of them as the assumed mean. Here, we take a = 3500. The calculations of the deviations and the product of the deviations with the corresponding frequencies have been represented in the following table.
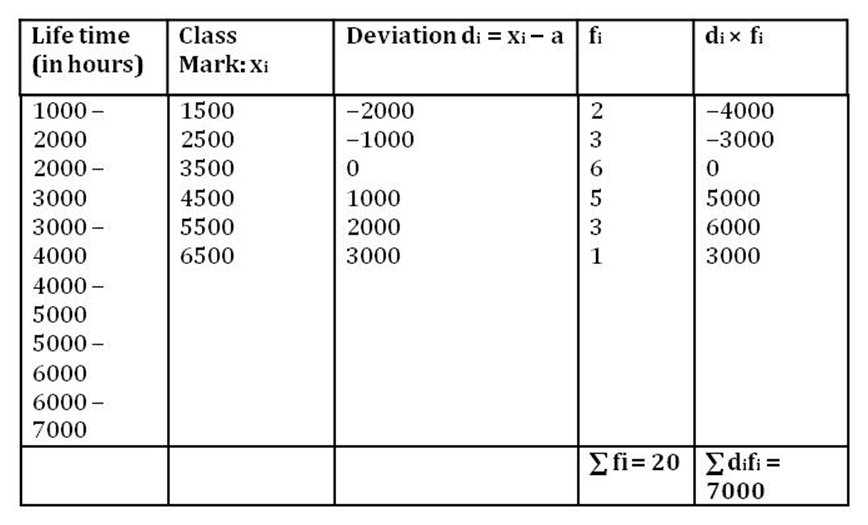
Using the formula,
= 3500 + 350
= 3850
Thus, the average lifetime of a bulb is 3850 h.
Example 2:
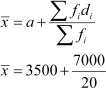
The following table shows the percentage of girls in the top 33 schools of Delhi.
Find the mean percentage of girls by using the assumed mean method.
Solution:
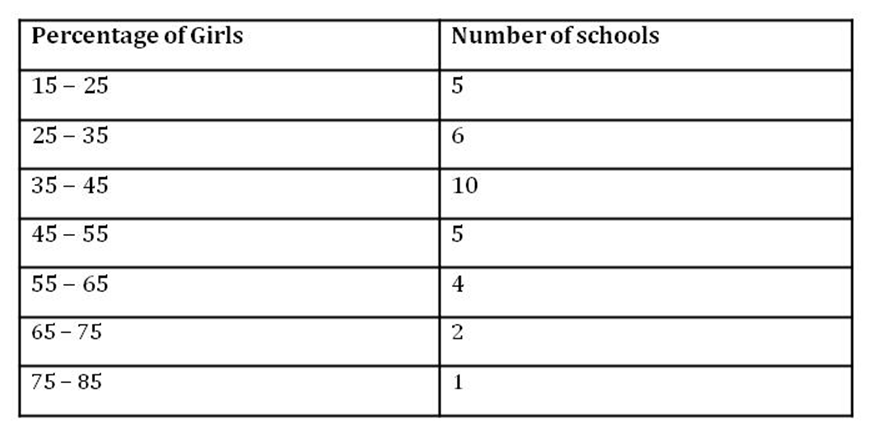
Firstly, we calculate the class mark of each class-interval and assume one of them as the assumed mean. Here, we take a = 50. The calculations of the deviations and the product of the deviations with the corresponding frequencies have been represented in the following table.
Using the formula,  , we obtain

Thus, the mean of the given data is 42.12 i.e., the mean percentage of girls in the 33 schools of Delhi is 42.12.
Mean Of Grouped Data Using Step Deviation Method
In the assumed mean method, we assume the mean as a from the class-marks and we use the following formula to find the actual mean.

Where, di is the deviation of a from xi.
When the data is given in the form of large numbers, then sometimes it is difficult and even lengthy to find the mean by using the assumed mean method. In such cases, we follow another method called step deviation method or shift of origin and scale method. Using this method, we can further reduce the calculation.
Example 1: Calculate the mean of the following data using step deviation method.
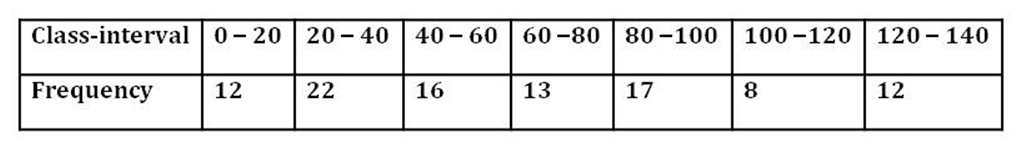
Solution:
Let us assume a = 50
Let us calculate the deviations of class marks from the assumed mean a. The calculations are shown in the following table.
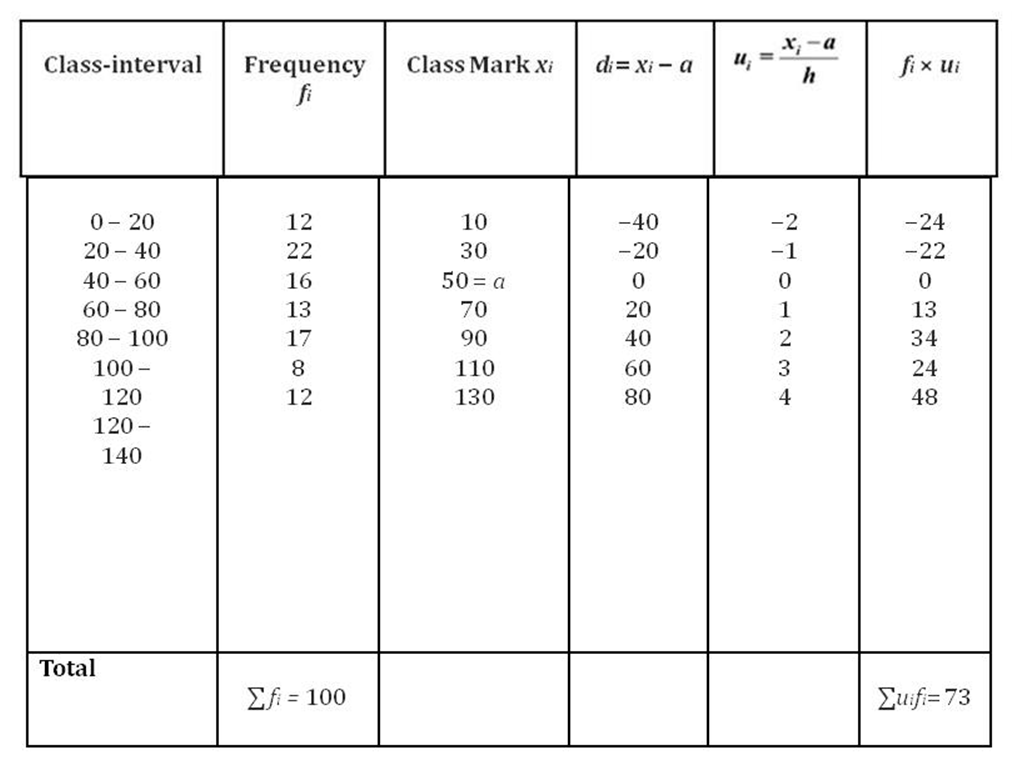
Highest common factor of all the di’s = h = 20
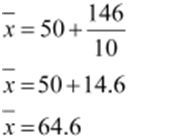
Now, using the formula , 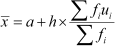 we obtain
![]() Thus, the mean of the given data is 64.6.
Thus, the mean of the given data is 64.6.