 Kaysons Publication
- Books Name
- Kaysons Academy Maths Foundation Book
- Publication
- Kaysons Publication
- Course
- JEE
- Subject
- Maths
Measures of Central Tendency
Earlier in this chapter, we represented the data in various forms through frequency distribution tables, bar graphs, histograms and frequency polygons. Now, the question arises if we always need to study all the data to ‘make sense’ of it, or if we can make out some important features of it by considering only certain representatives of the data. This is possible, by using measures of central tendency or averages.
Consider a situation when two students Mary and Hari received their test copies. The test had five questions, each carrying ten marks. Their scores were as follows:
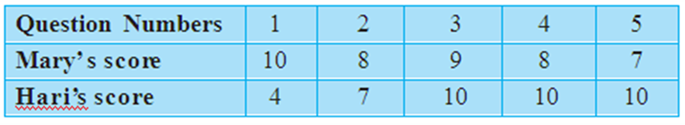
Upon getting the test copies, both of them found their average scores as follows:
![]()
![]()
Since Mary’s average score was more than Hari’s, Mary claimed to have performed better than Hari, but Hari did not agree. He arranged both their scores in ascending order and found out the middle score as given below:
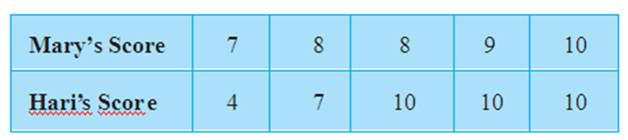
Hari said that since his middle-most score was 10, which was higher than Mary’s middle-most score, that is 8, his performance should be rated better.
But Mary was not convinced. To convince Mary, Hari tried out another strategy. He said he had scored 10 marks more often (3 times) as compared to Mary who scored 10 marks only once. So, his performance was better.
Now, to settle the dispute between Hari and Mary, let us see the three measures they adopted to make their point.
The average score that Mary found in the first case is the mean. The ‘middle’ score that Hari was using for his argument is the median. The most often scored mark that Hari used in his second strategy is the mode.
Now, let us first look at the mean in detail.
The mean (or average) of a number of observations is the sum of the values of all the observations divided by the total number of observations.
It is denoted by the symbol x , read as ‘x bar’.
Let us consider an example.
The median is that value of the given number of observations, which divides it into exactly two parts. So, when the data is arranged in ascending (or descending) order the median of ungrouped data is calculated as follows:
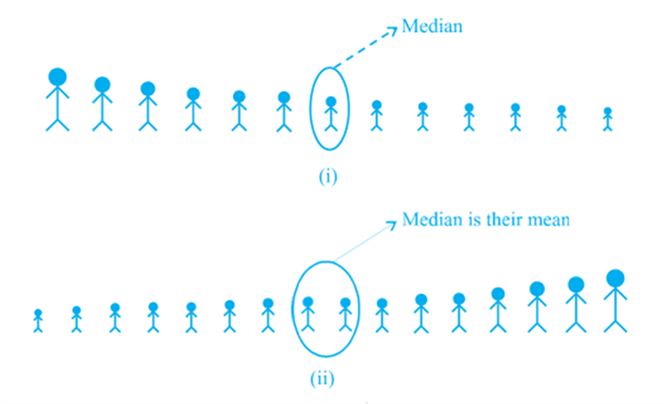
(i) When the number of observations (n) is odd, the median is the value of the ![]() observation. For example, if n = 13, the value of the
observation. For example, if n = 13, the value of the ![]() is., the 7th observation will be the median [see Fig (i)]
is., the 7th observation will be the median [see Fig (i)]
(ii) When the number of observations (n) is even, the median is the mean of the ![]() observations. For example, if n = 16, the mean of the value of the
observations. For example, if n = 16, the mean of the value of the ![]() observations, i.e., the mean of the values of the 8th and 9th observations will be the median [see Fig. (ii)].
observations, i.e., the mean of the values of the 8th and 9th observations will be the median [see Fig. (ii)].
The mode is that value of the observation with occurs most frequently, i.e., an observation with the maximum frequency is called the mode.
The ready made garment and shoe industries make great use of this measure of central tendency. Using the knowledge of mode, these industries decide which size of the product should be produced in large numbers.
