 Kaysons Publication
- Books Name
- Kaysons Academy Maths Foundation Book
- Publication
- Kaysons Publication
- Course
- JEE
- Subject
- Maths
Graph of a Linear Equation in Two Variables
So far, you have obtained the solutions of a linear equation in two variables algebraically. Now, let us look at their geometric representation. You know that each such equation has infinitely many solutions. How can we show them in the coordinate plane? You may have got some indication in which we write the solution as pairs of values. The solutions of the linear equation in Example 3, namely,
x + 2y = 6
Can be expressed in the form of a table as follows by writing the values of y below the corresponding values of x:
|
x |
0 |
2 |
4 |
6 |
. . . |
|
y |
3 |
2 |
1 |
0 |
. . . |
In the previous chapter, you studied how to plot the points on a graph paper. Let us plot the points (0, 3), (2, 2), (4, 1) and (6, 0) on a graph paper. Now join any two of these points and obtain a line. Let us call this as line AB (see Fig).
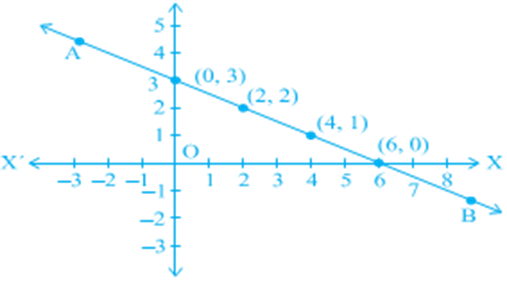
Do you see that the other two points also lie on the line AB? Now, pick another point on this line, say (8, –1). Is this a solution? In fact, 8 + 2(–1) = 6. So, (8, –1) is a solution. Pick any other point on this line AB and verify whether its coordinates satisfy the equation or not. Now, take any point not lying on the line AB, say (2, 0). Do its coordinates satisfy the equation? Check, and see that they do not.
Let us list our observations:
Every point whose coordinates satisfy Equation (1) lies on the line AB.
Every point (a, b) on the line AB gives a solution x = a, y = b of Equation (1).
Any point, which does not lie on the line AB, is not a solution of Equation (1).
So, you can conclude that every point on the line satisfies the equation of the line and every solution of the equation is a point on the line. In fact, a linear equation in two variables is represented geometrically by a line whose points make up the collection of solutions of the equation. This is called the graph of the linear equation. So, to obtain the graph of a linear equation in two variables, it is enough to plot two points corresponding to two solutions and join them by a line. However, it is advisable to plot more than two such points so that you can immediately check the correctness of the graph.
