Param Publication
- Books Name
- CBSE Class 7 Science Book
- Publication
- Param Publication
- Course
- CBSE Class 7
- Subject
- Science
Distance - Time Graph :
Let us try to understand the nature of motion of an object.
Time Odometer reading Distance from the strating points
8.00 am 1000 km 0 km
8.30 am 1100 km 100 km
9.00 am 1200 km 200 km
9.30 am 1300 km 300 km
10.00 am 1400 km 400 km
If we plot the graph between distance and time.
A straight line is obtained. Which mean that its a uniform motion and the speed of the object is constant.
While ploting a graph, one must keep in mind.
(a) The difference between the highest and the lowest values of each quantity.
(b) The intermediate values of each quantity, so that with the scale chosen, it is convenient to mark the values on the graph.
(c) To utilise the maximum part of the paper on which the graph is to be drawn.
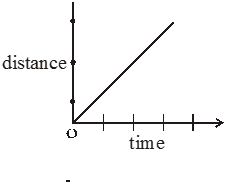
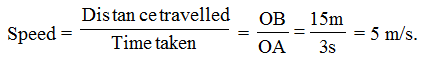
Ex.11 The figure given below shows the graphical representation of the movement of a body. Find its speed after three seconds. What information do you get from the graph?
Sol. Draw a perpendicular on the X-axis from point A (i.e., three seconds on time scale) which intersects the graph at point T. Now draw a line from T, parallel to X-axis which intersects the Y-axis at point B. You can now calculate the speed ofthe moving body after three seconds.

The information provided by a distance-time graph is as follows:
• The distance travelled by the body at a particular point of time
• The speed of the moving body
• The speed of the moving body is uniform
Extended Learning – Activities and Projects
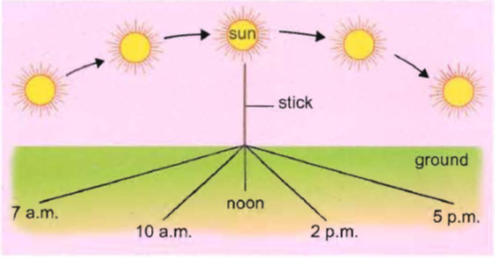
1. To observe the length of shadows during day time :
• Take a stick for this purpose and fix it in the open ground away from trees and buildings as shown in figure.
• Now observe the length of the shadow of the stick at different times of the day.
• Use a measuring tape to measure the length of the shadow. You will observe that the length of the shadow of the stick is smallest at noon when the sun is just above it. It is longest in the morning and evening when the sun is low in the sky. The shadow of the stick falls in a direction opposite to that of the source of light, i.e., the sun. So, the shadow moves according to the change in the position of the sun relative to the stick.
2. Collect information about time-measuring devices that were used in the ancient times in different parts of the world. Prepare a brief write up on each one of them. The write up may include the name of the device, the place of its origin, the period when it was used, the unit in which the time was measured by it and a drawing or a photograph of the device, if available.
(i) Rolling Ball clock. invented in 17th century by French engineer Nicolas Grollier. unit of time-15 seconds-1 min.
(ii) Candle clock.
used as early as A.D. 520 in China
unit of time-30 min to hrs.
(iii) Water clock
used in 16th century B.C. in Babylon
Uses steady flow of water to keep track of time.
3. You can perform an interesting activity when you visit a park to ride a swing. You will require a watch. Make the swing oscillate without anyone sitting on it. Find its time period in the same way as you did for the pendulum. Make sure that there are no jerks in the motion of the swing. Ask one of your friends to sit on the swing. Push it once and let it swing naturally. Again measure its time period. Repeat the activity with different persons sitting on the swing.
(i) Compare the time period of the swing measured in different cases.
(ii) What conclusions do you draw from this activity?
(i) Time is same in every case.
(ii) Time period does not depend upon mass.
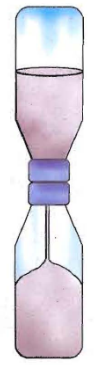
4. To make an hourglass or sand clock :
• Take two transparent plastic bottles of equal size.
• Cut a cardboard disc large enough to cover the mouths of the bottles and make a small hole in the centre of the cardboard.
• Put some sand in one bottle and place the cardboard disc on its mouth.
• Now invert the other bottle over the disc and with the help of a tape, seal the mouth of the two bottles as shown in figure. You r sand clock is ready. Invert the sand clock and watch the flow of sand. Note the time taken by the sand to flow from the bottle on top to the bottle at the bottom. Repeat the procedure. Note the time taken in each case.There is no difference in the time taken for the bottle to empty in both cases. You can measure a particular span of time with this sand clock.
5. To observe slow and fast motion and calculate the average speed :
• For this activity, you can use the football field or even the playground.
• With the help of a measuring tape, measure and mark a distance of 200 metres.
• Now ask your friends/classmates to travel this distance:
(a) walking slowly
(b) walking briskly
(c) running
(d) on a bicycle
• Measure the time taken by each one to travel this distance with the help of a stopwatch and note your observations as shown in the example in Table.
Time taken to cover a distance of 200 metres
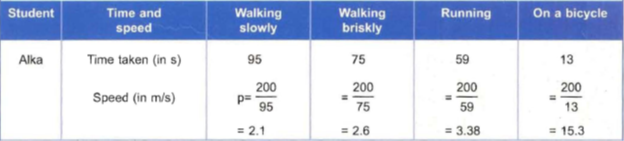
You will observe that :
• Minimum time is taken to travel the distance on a bicycle, thus it has the maximum speed.
• Maximum time is taken to travel the distance while walking slowly, so the speed is minimum here.
• The order of time taken is: slow walk> brisk walk> ru nning> cycling.
• The order of speed is: slow walk < brisk walk < running < cycling ,
Motion is dependent on the speed of the body. Higher the speed, faster is the motion and vice versa.
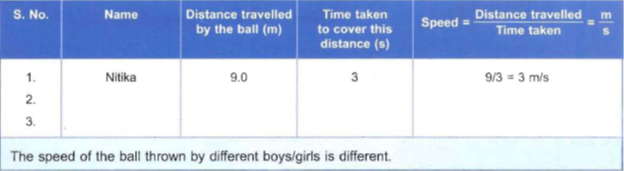
6. To find the speed of a moving ball :
• Take a ball, a measuring tape, a stopwatch and three of your friends to a playground.
• Put a mark or line on the ground and ask your friends to gently slide or throw the ball in one direction from this mark.
• When the ball comes to rest, mark this position also.
• Now measure the distance between the two markings which gives the distance travelled by the ball.
• Also measure the time taken by the ball to reach the state of rest with the help of the stopwatch.
• Put the values of distance and time taken in Table against the name of the boy/girl and also calculate the speed as shown in the given example.
Table : Distance travelled and time taken by a moving ball