 ReginaTagebücher
- Books Name
- class 7 Mathematics Book
- Publication
- ReginaTagebücher
- Course
- CBSE Class 7
- Subject
- Mathmatics
Bar graph
A bar graph is a representation of numbers using bars of uniform width and the lengths of the bars depend upon the frequency and the scale you have chosen.
It is a method of representing data visually. In the case of bar graph or bar diagram, Bars of uniform width are drawn horizontally or vertically with equal spacing between them and then the length of each bar represents the given number.
Drawing a Bar Graph
To draw a bar graph, first of all draw a horizontal line and a vertical line.
On the horizontal line we will write the name of students and on vertical line we will write numerals which show what data is being represented.
Same data can also be represented by interchanging the items on horizontal and vertical axis.
It is important to take bars of same width keeping uniform gap between them. Next, a scale is chosen if needed.
The scale varies according to the data given. One block is equivalent to ten units.
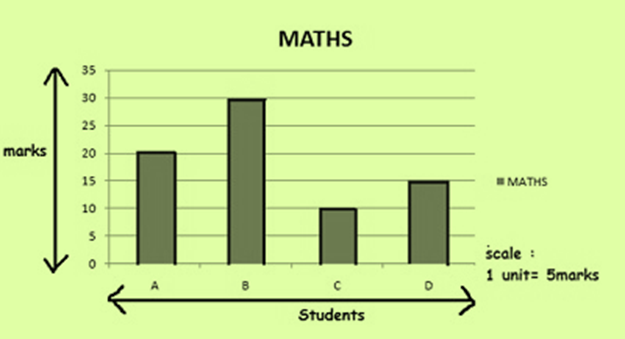
Example 1: Draw simple bar graph .Let there be 4 students A,B,C and D. The total marks Maths test is 40.

Answer:-
Double Bar Graph
A simple bar graph represents one set of data. For e.g score of students in a Maths.
A bar graph is drawn in a similar way to simple bar graph.
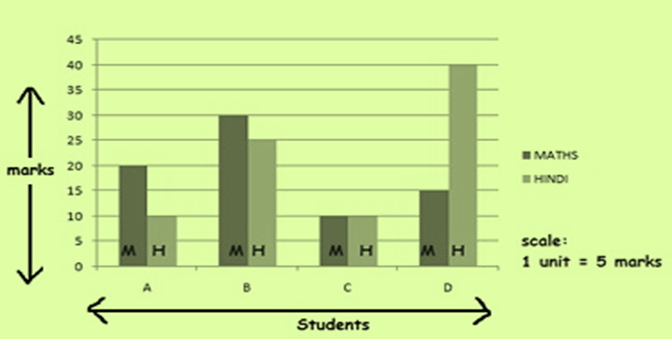
A double graph represents two sets of data in one graph.For eg score of students in Maths and Hindi.
Example 2 : Let there be 4 students A,B,C and D. The total marks for both hindi and Maths test is 40.double bar graphs can be obtained as:
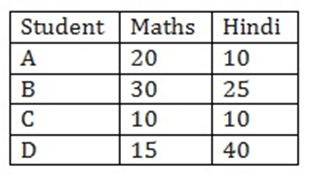
Answer:-