 ReginaTagebücher
 Param Publication
- Books Name
- CBSE Class 7 Mathematics Book
- Publication
- Param Publication
- Course
- CBSE Class 7
- Subject
- Mathmatics
TYPES OF DATA
There are two types of data:
(a) Primary data: Data collected by a person directly (by himself) is called primary data.
(b) Secondary data : Data which are already collected by a person or a society and these may be in published or unpublished sources are known as secondary data. These data should be carefully used.
For Example
(i) Data published by the state or central governments.
(ii) Reports published by international organisations like U.N.O.
The data collected by someone for himself and used by someone else is called secondary data.
Observation: Each numerical figure in the data is called an observation.
For example, the marks obtained by 30 students in mathematics (out of 40) are:
30, 25, 18, 25, 39, 18, 25, 30, 28, 17,
15, 30, 30, 35, 36, 36, 35, 30, 25, 20,
25, 28, 18, 17, 16, 30, 36, 35, 27, 28.
1. Array
Sequentailly arranged data either in ascending or descending order is called an array.
This is a raw data and the marks obtained by each student is an observation. Thus, there are
30 observations in this raw data.
We arrange the above marks in ascending order as below:
15, 16, 17, 17, 18, 18, 18, 20, 25, 25,
25, 25, 25, 27, 28, 28, 28, 30, 30, 30,
30, 30, 30, 35, 35, 35, 36, 36, 36, 39
2. Range: The difference between the highest and lowest observation in a given data is called its range.
Illustration 1
Find the range for the following data:
45, 47, 45, 86, 62, 80, 48, 41, 31, 51, 99, 80, 78.
Solution
The smallest observation = 31 The largest observation = 99
Range = 99 – 31 = 68
3. Frequency: Number of times occurrence of a particular information (observation) is called the frequency of that information (observation).
(i) Ungrouped Frequency Distribution : If the data is large and not classified in groups then for there representation we use tally marks according to there frequency this distribution is known as ungrouped frequency distribution.
(ii) Grouped Frequency Distribution : When the list of observations is long, the data is usually organized into groups called class intervals and the data so obtained is called a grouped data.
- Lower Limit and Upper Limit : The lower value of a class interval is called its lower limit and the upper value of class interval is called its upper limit.
- The size or the Width of the Class Interval : The difference between the upper and the lower class limits is called the size or width of the class interval.
For example :
The size of the class intervals = Upper Limit – Lower Limit
- Class Marks : The mid value of a class interval is called its class mark. It is obtained by adding its upper and lower limit and dividing by 2.
![]()
4. Tally Marks: Figurative representation of frequency using vertical lines. The use of tally marks can be understood from the undetermined illustration.
Illustration 2
Given below is the data showing the number of cars in 25 families of a locality.
3, 1, 3, 2, 2, 2, 0, 3, 4, 2, 1, 3, 2, 4, 1, 2, 2, 3, 1, 3, 4, 0, 1, 2, 4,
Arrange the data in ascending order and prepare the frequency table.
Solution
Arranging the data in ascending order we get
0, 0, 1, 1, 1, 1, 1, 2, 2, 2, 2, 2, 2, 2, 2, 3, 3, 3, 3, 3, 3, 4, 4, 4, 4
Table for the same is represented as below. We have introduced a column tally marks which represents the frequency of a number.
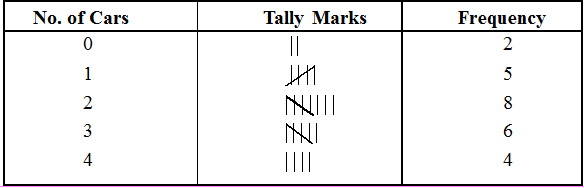
Illustration 3
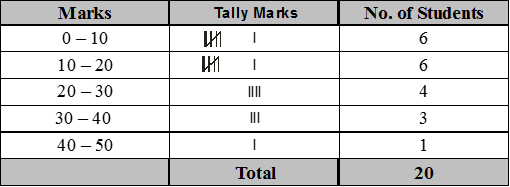
In an examination the marks obtained by 20 students of class VII are given below :
14, 2, 7, 12, 15, 16, 22, 13, 24, 2, 26, 5, 29, 18, 31, 36, 38, 1, 47, 4.
Make a frequency distribution table of same class size and one such class being 0 – 10.
Solution