 Param Publication
 ReginaTagebücher
1. Arithmetic mean
- Books Name
- class 7 Mathematics Book
- Publication
- ReginaTagebücher
- Course
- CBSE Class 7
- Subject
- Mathmatics
Chapter 3
Data handling
Arithmetic mean
Data handling may be as simple as drawing on a sheet of paper or the completion of entry forms on a computer screen. Data is a collection of numbers gathered to give some information
For eg the marks of students in the class or the amount of various goods shopped from the market.

2. Mode
- Books Name
- class 7 Mathematics Book
- Publication
- ReginaTagebücher
- Course
- CBSE Class 7
- Subject
- Mathmatics
Mode
The mode of a set of observations is the observation that occurs most often.
When the number of observations is large, observing them together is not easy. In case of large data, tabulation can be done by putting tally marks and finding the frequency. The observation with the highest frequency is the mode of the data.
3. Median
- Books Name
- class 7 Mathematics Book
- Publication
- ReginaTagebücher
- Course
- CBSE Class 7
- Subject
- Mathmatics
Median
Median refers to the value which lies in the middle of the data when data is arranged in an increasing or decreasing order. Half of the observations lie above the median and the other half below it.
To calculate the median, the data is first arranged in an ascending or descending order. Then the middle value is observed.
For eg; 2, 4, 6, 8, 9
6 is the median in this case since it lies in the middle. There are two observations above and below 6.
In case of odd number of observation, the value of median is one of the observations in the existing data.
In case of odd number of observation, the value of median is one of the observations in the existing data.
In case of even number of observations, the value of median is not one of the observations in the existing data.
4. Bar graph
- Books Name
- class 7 Mathematics Book
- Publication
- ReginaTagebücher
- Course
- CBSE Class 7
- Subject
- Mathmatics
Bar graph
A bar graph is a representation of numbers using bars of uniform width and the lengths of the bars depend upon the frequency and the scale you have chosen.
It is a method of representing data visually. In the case of bar graph or bar diagram, Bars of uniform width are drawn horizontally or vertically with equal spacing between them and then the length of each bar represents the given number.
Drawing a Bar Graph
To draw a bar graph, first of all draw a horizontal line and a vertical line.
On the horizontal line we will write the name of students and on vertical line we will write numerals which show what data is being represented.
Same data can also be represented by interchanging the items on horizontal and vertical axis.
It is important to take bars of same width keeping uniform gap between them. Next, a scale is chosen if needed.
The scale varies according to the data given. One block is equivalent to ten units.
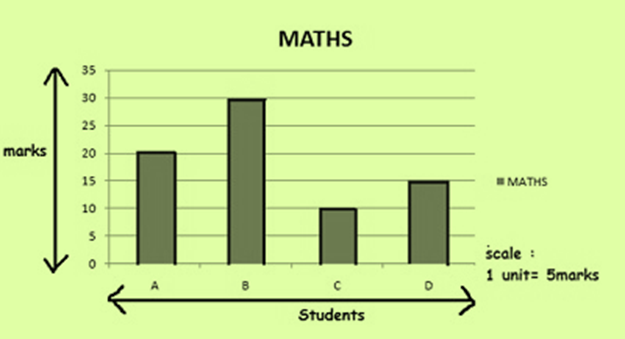
Example 1: Draw simple bar graph .Let there be 4 students A,B,C and D. The total marks Maths test is 40.

Answer:-
Double Bar Graph
A simple bar graph represents one set of data. For e.g score of students in a Maths.
A bar graph is drawn in a similar way to simple bar graph.
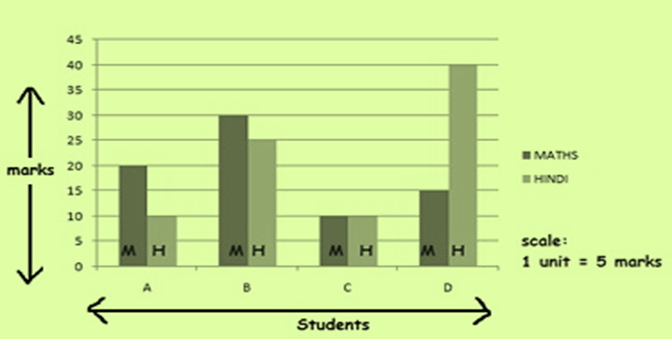
A double graph represents two sets of data in one graph.For eg score of students in Maths and Hindi.
Example 2 : Let there be 4 students A,B,C and D. The total marks for both hindi and Maths test is 40.double bar graphs can be obtained as:
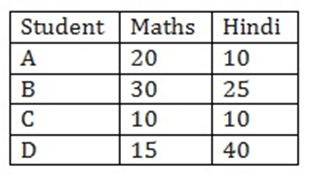
Answer:-
5. Chance and probability
- Books Name
- class 7 Mathematics Book
- Publication
- ReginaTagebücher
- Course
- CBSE Class 7
- Subject
- Mathmatics
Chance and probability
There are situations in our life, that are certain to happen, some that are impossible and some that may or may not happen. The situation that may or may not happen has a chance of happening.
Probability is the chance of occurrence of an event. It tells us about the likelihood of the occurrence or non occurrence of an event. Events that have many possibilities can have probability between 0 and 1.

