 ReginaTagebücher
 Param Publication
1. Arithmetic mean
- Books Name
- CBSE Class 7 Mathematics Book
- Publication
- Param Publication
- Course
- CBSE Class 7
- Subject
- Mathmatics
INTRODUCTION
In this chapter we will learn
1. Various forms of data
2. Organization of data
3. Useful forms of data representation.
Data: Information presented in the form of numerical figures. For example:
“Rajesh has 15 books” is a data whereas nearly saying that
“Rajesh has large number of books” is not a data.
- Raw Data: Data as obtained from the source, generally in unarranged form.
2. Mode
- Books Name
- CBSE Class 7 Mathematics Book
- Publication
- Param Publication
- Course
- CBSE Class 7
- Subject
- Mathmatics
TYPES OF DATA
There are two types of data:
(a) Primary data: Data collected by a person directly (by himself) is called primary data.
(b) Secondary data : Data which are already collected by a person or a society and these may be in published or unpublished sources are known as secondary data. These data should be carefully used.
For Example
(i) Data published by the state or central governments.
(ii) Reports published by international organisations like U.N.O.
The data collected by someone for himself and used by someone else is called secondary data.
Observation: Each numerical figure in the data is called an observation.
For example, the marks obtained by 30 students in mathematics (out of 40) are:
30, 25, 18, 25, 39, 18, 25, 30, 28, 17,
15, 30, 30, 35, 36, 36, 35, 30, 25, 20,
25, 28, 18, 17, 16, 30, 36, 35, 27, 28.
1. Array
Sequentailly arranged data either in ascending or descending order is called an array.
This is a raw data and the marks obtained by each student is an observation. Thus, there are
30 observations in this raw data.
We arrange the above marks in ascending order as below:
15, 16, 17, 17, 18, 18, 18, 20, 25, 25,
25, 25, 25, 27, 28, 28, 28, 30, 30, 30,
30, 30, 30, 35, 35, 35, 36, 36, 36, 39
2. Range: The difference between the highest and lowest observation in a given data is called its range.
Illustration 1
Find the range for the following data:
45, 47, 45, 86, 62, 80, 48, 41, 31, 51, 99, 80, 78.
Solution
The smallest observation = 31 The largest observation = 99
Range = 99 – 31 = 68
3. Frequency: Number of times occurrence of a particular information (observation) is called the frequency of that information (observation).
(i) Ungrouped Frequency Distribution : If the data is large and not classified in groups then for there representation we use tally marks according to there frequency this distribution is known as ungrouped frequency distribution.
(ii) Grouped Frequency Distribution : When the list of observations is long, the data is usually organized into groups called class intervals and the data so obtained is called a grouped data.
- Lower Limit and Upper Limit : The lower value of a class interval is called its lower limit and the upper value of class interval is called its upper limit.
- The size or the Width of the Class Interval : The difference between the upper and the lower class limits is called the size or width of the class interval.
For example :
The size of the class intervals = Upper Limit – Lower Limit
- Class Marks : The mid value of a class interval is called its class mark. It is obtained by adding its upper and lower limit and dividing by 2.
![]()
4. Tally Marks: Figurative representation of frequency using vertical lines. The use of tally marks can be understood from the undetermined illustration.
Illustration 2
Given below is the data showing the number of cars in 25 families of a locality.
3, 1, 3, 2, 2, 2, 0, 3, 4, 2, 1, 3, 2, 4, 1, 2, 2, 3, 1, 3, 4, 0, 1, 2, 4,
Arrange the data in ascending order and prepare the frequency table.
Solution
Arranging the data in ascending order we get
0, 0, 1, 1, 1, 1, 1, 2, 2, 2, 2, 2, 2, 2, 2, 3, 3, 3, 3, 3, 3, 4, 4, 4, 4
Table for the same is represented as below. We have introduced a column tally marks which represents the frequency of a number.
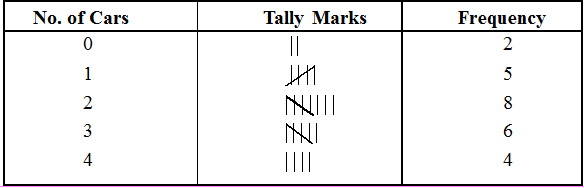
Illustration 3
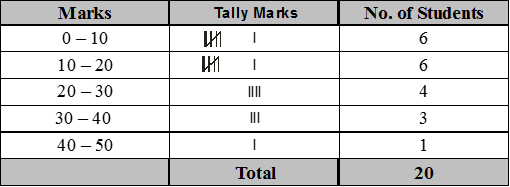
In an examination the marks obtained by 20 students of class VII are given below :
14, 2, 7, 12, 15, 16, 22, 13, 24, 2, 26, 5, 29, 18, 31, 36, 38, 1, 47, 4.
Make a frequency distribution table of same class size and one such class being 0 – 10.
Solution
5. Chance and probability
- Books Name
- CBSE Class 7 Mathematics Book
- Publication
- Param Publication
- Course
- CBSE Class 7
- Subject
- Mathmatics
MEAN OF UNGROUPED DATA
Mean is statistics is same as the average in arithmetic.
![]()
Illustration 4
Find the mean of the following data: 4, 2, 3, 9, 6, 5, 1.
Solution
Sum of given numbers (observations) = 30
number of given numbers (observations) = 7
![]()
Illustration 5
Following are the ages (in years) of 10 teachers in a school: 42, 28, 32, 41, 33, 54, 27, 23, 34, 37.
(a) What is the age of the oldest teacher and that of the youngest teacher ?
(b) What is the range ?
(c) What is the mean age of the teachers ?
(d) What will be the new mean age if a new teacher aged 34 years is employed?
Solution
(a) Clearly the age of the oldest teacher in the school is 54 years and that of the youngest teacher is 23 years.
(b) The range = 54 - 23 or 31 years
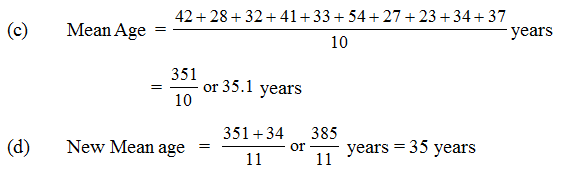
Illustration 6
Mean attendance of a class from Monday to Saturday was 33. If the mean attendance of Monday, Tuesday and Wednesday was 32 and that of Wednesday, Thursday, Friday and Saturday was 34, find the attendance on Wednesday.
Solution
Mean attendance from Monday to Saturday = 33
Total attendance from Monday to Saturday = 33 x 6 = 198 ...(i)
Mean attendance of Monday, Tuesday, Wednesday = 32
Total attendance of Monday, Tuesday, Wednesday = 32 x 3 = 96 ...(ii)
Mean attendance of Wednesday, Thursday, Friday, Saturday = 34
Total attendance of Wednesday, Thursday, Friday, Saturday
= 34 × 4 = 136 ...(iii)
From (ii) and {iii),
we get Total attendance from Monday to Saturday + Wednesday
= 96 + 136 = 232 ...(iv)
From (i) and (iv), we get
Attendance on Wednesday = 232 – 198 = 34
6. Median
- Books Name
- CBSE Class 7 Mathematics Book
- Publication
- Param Publication
- Course
- CBSE Class 7
- Subject
- Mathmatics
Mode of Ungrouped Data
Mode: The value which occurs most is called mode. In other words the value of the observation which has maximum frequency in a data is called mode.
Illustration 10
The marks obtained by 10 students are as follows :
5, 6, 3, 7, 4, 6, 9, 2, 1, 6
Find the mode of the marks.
Solution
Arranging the data in ascending order
We get 1, 2, 3, 4, 5, 6, 6, 6, 7, 9
We can see that 6 occurs most of the time, hence 6 is the mode.
Illustration 11
Find the mode of the following data:
(i) 2, 2, 3, 3, 4, 4, 4, 5, 6, 6, 7
(ii) 31, 35, 36, 33, 32, 35, 36, 31, 34, 33, 36, 34, 32, 32, 36, 34.
Solution
(i) 4 occurs the maximum number of times, i.e., 3
∴ Mode = 4
(ii) Arranging data in the ascending order, we get
31, 31, 32, 32, 32, 33, 33, 34, 34, 34, 35, 35, 36, 36, 36, 36.
Here 36 occurs the maximum number of times, i.e., 4
Illustration 12
Find the mode from the following data:
![]()
Solution
Here the maximum frequency is 7.
The marks obtained against 7 is 43
Hence, Mode = 43 marks
7. Use of bar graph with a different purpose
- Books Name
- CBSE Class 7 Mathematics Book
- Publication
- Param Publication
- Course
- CBSE Class 7
- Subject
- Mathmatics
MEDIAN OF UNGROUPED DATA
1. MEDIAN
The median is the value which is strictly in the middle of the list of the observations when written in order of size, i.e., in ascending or descending order. It is also a measure of central tendency.
(i) When the number of observations is odd, then there will be only one mid term and this term is the median.
n = number of terms
If n = odd
![]()
(ii) When the number of observations is even, then there will be two middle terms. The average of these middle terms will be the median of the data.
If n = even
![]()
Illustration 8
Find the median of:
(i) 5, 9, 6, 4, 7, 2, 8 (ii) 2, 5, 3, 2, 4, 5, 2, 4, 6, 8, 7, 9, 7.
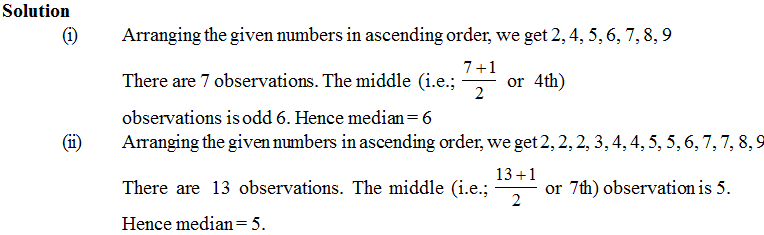
Illustration 9
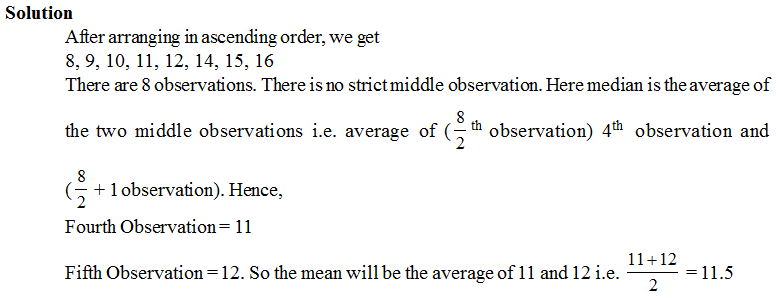
Find the median of the following data:
11, 10, 12, 9, 8, 16, 15, 14
8. Chance and probability
- Books Name
- CBSE Class 7 Mathematics Book
- Publication
- Param Publication
- Course
- CBSE Class 7
- Subject
- Mathmatics
Graphical Representation of Data
A Bar graph is a graphical representation of the numerical data by a number of bars (rectangles) of uniform with erected horizontally or vertically with equal spacing between them.
Graphical representation of numericals data in the form of bars with fixed (equal) width and varying height.
Method to draw Bar Graphs :
Step 1 : Draw a horizontal line OX also called as x-axis and a vertical line OY also called as y-axis.
Step 2 : Mark points at equal intervals along x-axis. Write the names of the data whose values are to be plotted.
Step 3 : After choosing a suitable scale, determine the heights of the values of the respective data names.
Step 4: Mark off these heights parallel to the y-axis from the points taken in step 2.
Step 5 : On the x-axis draw bars of equal width for the heights marked in step 4. The bars should be centered on the points marked on the x-axis. These bars represent the given numerical data.
Illustration 13
In a particular section of Class VIII, 40 students were asked about the months of their birth and the following graph was prepared for the data so obtained :
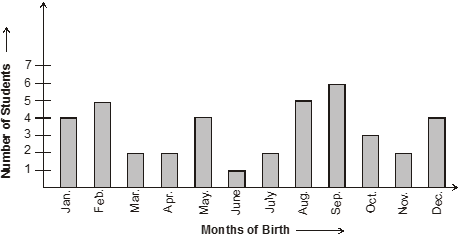
(i) How many students were born in the month of November ?
(ii) In which month were the maximum number of students born ?
(iii) In which month were the minimum number of students born ?
Solution
Note that the variable here is the ‘month of birth’, and the value of the variable is the ‘Number of students born’.
(i) 2 students were born in the month of November.
(ii) The maximum number of students were born in the month of September.
(iii) The minimum number of students were born in the month of June.
