 ReginaTagebücher
 Param Publication
- Books Name
- CBSE Class 7 Mathematics Book
- Publication
- Param Publication
- Course
- CBSE Class 7
- Subject
- Mathmatics
MEAN OF UNGROUPED DATA
Mean is statistics is same as the average in arithmetic.
![]()
Illustration 4
Find the mean of the following data: 4, 2, 3, 9, 6, 5, 1.
Solution
Sum of given numbers (observations) = 30
number of given numbers (observations) = 7
![]()
Illustration 5
Following are the ages (in years) of 10 teachers in a school: 42, 28, 32, 41, 33, 54, 27, 23, 34, 37.
(a) What is the age of the oldest teacher and that of the youngest teacher ?
(b) What is the range ?
(c) What is the mean age of the teachers ?
(d) What will be the new mean age if a new teacher aged 34 years is employed?
Solution
(a) Clearly the age of the oldest teacher in the school is 54 years and that of the youngest teacher is 23 years.
(b) The range = 54 - 23 or 31 years
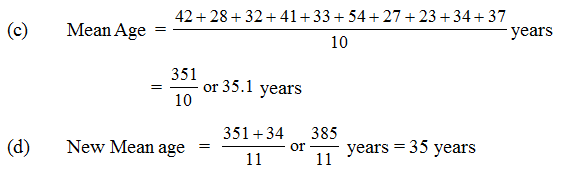
Illustration 6
Mean attendance of a class from Monday to Saturday was 33. If the mean attendance of Monday, Tuesday and Wednesday was 32 and that of Wednesday, Thursday, Friday and Saturday was 34, find the attendance on Wednesday.
Solution
Mean attendance from Monday to Saturday = 33
Total attendance from Monday to Saturday = 33 x 6 = 198 ...(i)
Mean attendance of Monday, Tuesday, Wednesday = 32
Total attendance of Monday, Tuesday, Wednesday = 32 x 3 = 96 ...(ii)
Mean attendance of Wednesday, Thursday, Friday, Saturday = 34
Total attendance of Wednesday, Thursday, Friday, Saturday
= 34 × 4 = 136 ...(iii)
From (ii) and {iii),
we get Total attendance from Monday to Saturday + Wednesday
= 96 + 136 = 232 ...(iv)
From (i) and (iv), we get
Attendance on Wednesday = 232 – 198 = 34
