 PathSet Publications
SAVING FUNCTION (PROPENSITY TO SAVE)
Definition: Saving function refers to a functional relationship between saving and national income.
S= f(Y)
Where, S = Saving, Y = National Income, f = Functional relationship
Saving Schedule and Curve:
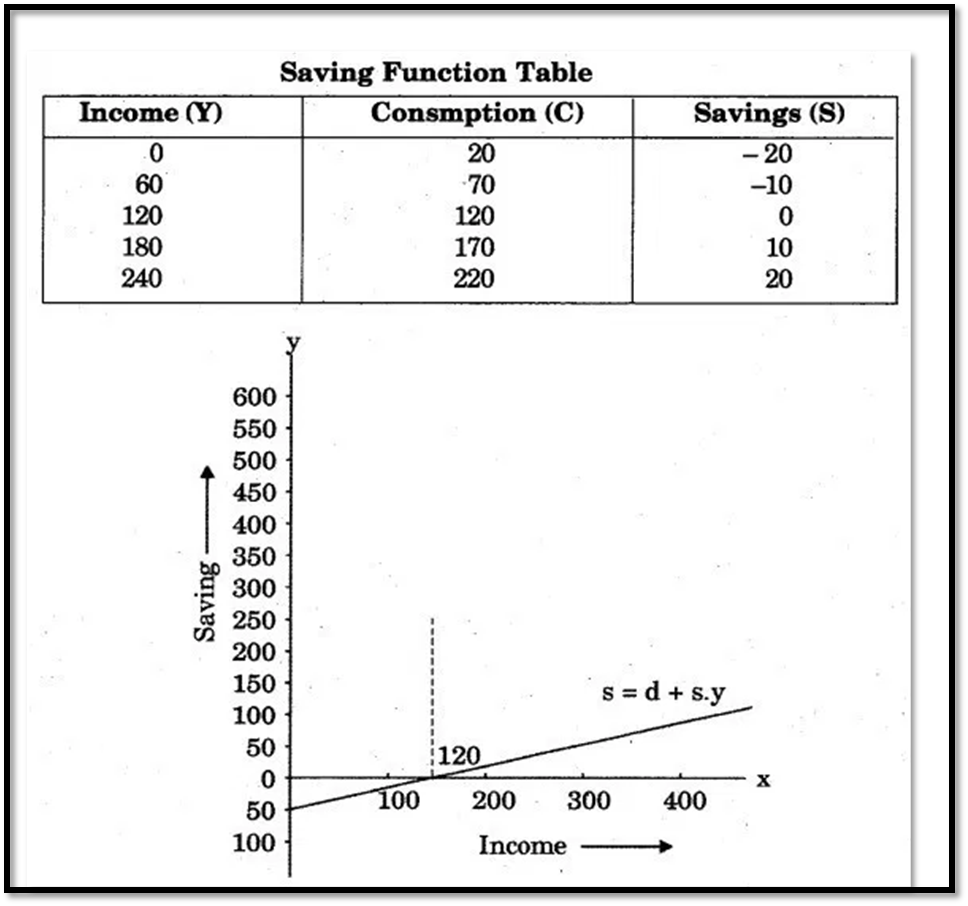
Saving curve (SS) starts from a below point on the Y-axis, indicating that there is negative saving (equal to amount of autonomous consumption) when national income is zero.
Note: The saving curve will have a negative intercept on Y-axis of the same magnitude as the consumption curve has positive intercept on the Y-axis. It happens because if consumption were positive at zero level of income, then there would be dis-savings of the same magnitude.
Break-even point (S = 0). Saving curve crosses the X-axis at point R which is known as break-even point as at this point saving is zero (or consumption is equal to income).
Positive Saving: After the break-even point, saving is positive.
