 PathSet Publications
DEVELOPMENT JOURNEY
Comparative Development Experiences of India and its Neighbours
Development Path of India, Pakistan and China
- India, Pakistan and China have many similarities in their developmental strategies.
- All three nations started their developmental path at the same time.
- India and Pakistan got independence in 1947 and the People's Republic of China were established in 1949.
- All the-three countries had started planning their development strategies in similar ways. India announced its first Five Year Plan in 1951, Pakistan announced in 1956 and China in 1253.
- Since 2013, Pakistan is working on the basis of 11th Five Year Development Plan (2013-18), while China is working on 13th Five Year Plan (2016-20). Until March 2017, India has been following Five Year Plan-based development model.
- India and Pakistan adopted similar strategies, such as creating a large public sector and raising public expenditure on social development.
- Till 1980s, all the three countries had similar growth rates and per capita incomes. All the three countries have performed differently. India and Pakistan have made slow and irregular progress as compared to China, which has made miraculous progress.
ANALYSIS OF CHINA
China
- Historical Background: China has one of the world's oldest people and continuous civilizations, consisting of states and cultures dating back more than six millennia. The People's Republic of China (PRC), commonly known as China, was established in 1949.
- Geography: China is situated in eastern Asia, bounded by the Pacific in the east. It is the third-largest country in the world, next to Canada and Russia, with an area of 9.6 million square kilometers.
- Population and Language: China is the most populous country in the world with 1,371 million people (as per 2015 estimates) and a growth rate of 0.5% per annum. Most languages in China belong to the Sino-Tibetan language family, spoken by 29 ethnicities. There are also several major dialects within the Chinese language itself.
- Economy: Being one of the oldest civilizations in the world, China has been the world's largest economy. After the establishment of the People's Republic of China under one-party rule, all the critical sectors of the economy, enterprises and lands owned and operated by individuals, were brought under government control.
- Great Leap Forward (GLF) campaign:
- In 1958, a program named 'The Great Leap 42...Forward (GLF)' campaign was initiated by Mao to modernize China's economy.
- The aim of this campaign was to transform the agrarian economy into a modern economy through the process of rapid industrialization.
- Under this program, people were encouraged to set up industries in their backyards.
- In rural areas, communes were started. Under the Commune system, people collectively cultivated lands.
- 1958, there were 26,000 communes, covering almost all the farm population.
- GLF campaign met with many problems. A severe drought caused havoc in China killing about 30 million people.
- Great Proletarian Cultural Revolution:
- In 1965, Mao introduced the Great Proletarian Cultural Revolution (1966-76), under which students and professionals were sent to work and learn from the countryside. However, when Russia had conflicts with China, it withdrew its professionals, who had earlier been sent to China to help in the industrialization process.
- Reforms Introduced in China:
- In the initial phase, reforms were initiated in agriculture, foreign trade and investment sectors.
- In agriculture, commune lands were divided into small plots which were allocated (only for the use and not as ownership) to the individual households.
- They were allowed to keep all income from the land after paying stipulated taxes.
- In the later phase, reforms were initiated in the industrial sector.
- Private sector firms and township and village enterprises (enterprises that were owned and operated by local collectives) were allowed to produce goods.
- At this stage, enterprises owned by the government (known as State-Owned Enterprises or SOEs), were made to face competition.
- Dual Pricing in the Reforms Process:
The reform process also involved dual pricing. This means fixing the prices in two ways:
- Farmers and industrial units were required to buy and sell fixed quantities of inputs and outputs on the basis of prices fixed by the government.
- For other transactions, the inputs and outputs were purchased and sold at market prices.
- Special Economic Zones (SEZ):
In order to attract foreign investors, special economic zones were set up.
ANALYSIS OF PAKISTAN
Pakistan
Historical Background:
Pakistan, officially the Islamic Republic of Pakistan, gained independence on 14 August 1947. In 1971, a civil war in East Pakistan resulted in the independence of Bangladesh. Pakistan's history has been characterized by periods of economic growth, military rule and political instability.
Geography:
Pakistan is located in South Asia and borders Central Asia and the Middle East. Its borders are with China in the North and towards the West and Northwest are Iran and Afghanistan and towards the East and South East, its borders are with India. The country has an area of 7,96,095 square kilometers. The total cultivated area is 2,21,300 square kilometers, whereas the area under forest is 42,300 square kilometers.
Population and Language:
Pakistan is the sixth most populous country in the world with 188 million people (as per 2015 estimates) with a growth rate of 2.1% per annum. One-third of the total population lives below the official poverty line. It has the second-largest Muslim population in the world after Indonesia. The national language is Urdu and English is the official language.
Economy:
- Mixed Economic System: Pakistan follows the mixed economy model with the co-existence of public and private sectors.
- Introduction of Various Policies: In the late 1950s and 1960s, Pakistan introduced a variety of regulated policy frameworks for the growth of domestic industries. The policy combined tariff Protection for manufacturing of consumer goods, together with direct import controls on competing imports.
- Green Revolution: In the case of agriculture, the introduction of the Green Revolution and increase in public investment in infrastructure led to a rise in the production of food grains. This changed the agrarian structure dramatically.
- Importance to Role of Public Sector in the early 1970s: In the early 1970s, the nationalization of capital goods industries took place.
- Importance of Role of Private Sector in the late 1970s: In the late 1970s, there was a shift in the government policy, when it adopted the policy of denationalization. The government encouraged the private sector and also offered various incentives to them. All this created a conducive climate for new investments.
- Financial Support during the late 1970s: During this period, Pakistan also received financial support from (i) Western nations; and (ii) Remittances from emigrants to the Middle-east. This helped the country in stimulating economic growth.
- Reforms: In 1988, reforms were initiated in the country.
COMPARATIVE STUDY - INDIA, CHINA & PAKISTAN
COMPARATIVE STUDY: INDIA, CHINA AND PAKISTAN
Demographic Indicators
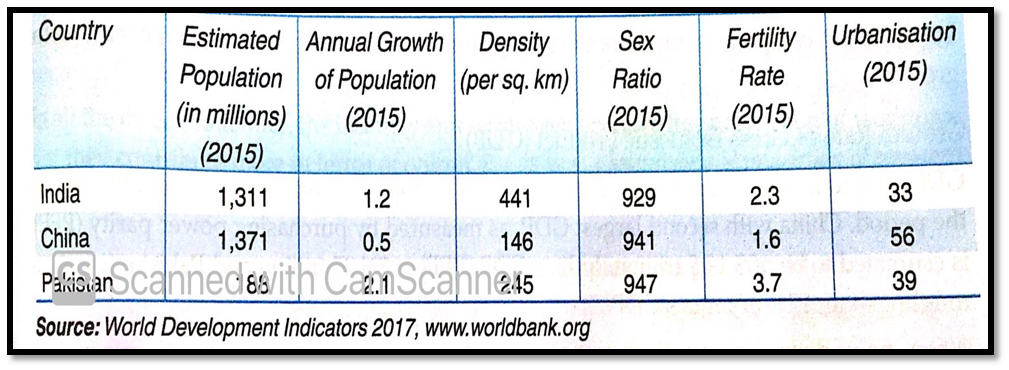
- Population: China is the most populous country in the world with 1,371 million people and India is the second most populated country with 1,311 million people. As compared to China or India, the population of Pakistan is very less (188 million people). If we look at the global population, out of every six persons living in this world, one is an Indian and another Chinese. The population of Pakistan is very small and accounts for roughly one-tenth of China or India.
- Growth Rate of Population: Though China is the most populated country, its annual growth rate population is the lowest (0.5%) as compared to India (1.2%) and Pakistan (2.1%). The reason for the low growth of population is the 'One-Child policy' introduced in China in the late 1970s. 'One-Child Policy" of China has successfully reduced the growth rate of population and provides a better health service for women and has reduced the risk of death and injury associated with Pregnancy. However, this policy has some other implications also. For instance, after a few decades, there will be more elderly people in proportion to young people in China. This will force China to take steps to provide social security measures with fewer workers.
- Density of Population: China is the third-largest country in the world and growth rate of Population is lowest in China as compared to India and Pakistan. As a result, density of population of China is the lowest (146 persons per sq. km) as compared to India (441 Persons per sq. km) and Pakistan (245 persons per sq. km).
- Sex Ratio: Due to the preference for sons, the sex ratio is low and biased against females in all the three countries. Sex ratio is the lowest in India with 929 females per 1,000 males. In China and Pakistan, the corresponding figures are 941 and 947. In recent times, all three countries are adopting various measures to improve the situation.
- Fertility Rate: Fertility Rate is calculated as the number of children borne by a woman of the reproductive age (15-45 years), on average. Since the introduction of the one-child policy, the fertility rate in China has fallen from over 3 births per woman in 1980 to approximately 1.6 births. Fertility rate is the highest in Pakistan at 3.7 births per woman and India comes second with 2.3 births per woman
- Urbanization: Urbanisation is the highest in China (56%, In India and Pakistan, the corresponding figures are 3,3% and 39%.
Growth Indicators
Growth Rate of Gross Domestic Product (GDP)
GDP growth rate is considered the single most important indicator of an economy during the period. China with the second-largest GDP, as measured by purchasing power parity (PPP), is estimated to be $ 19.8 trillion. India, GDP (PPP) is 8.07 trillion and Pakistan, GDP is roughly about 12% of India’s GDP.
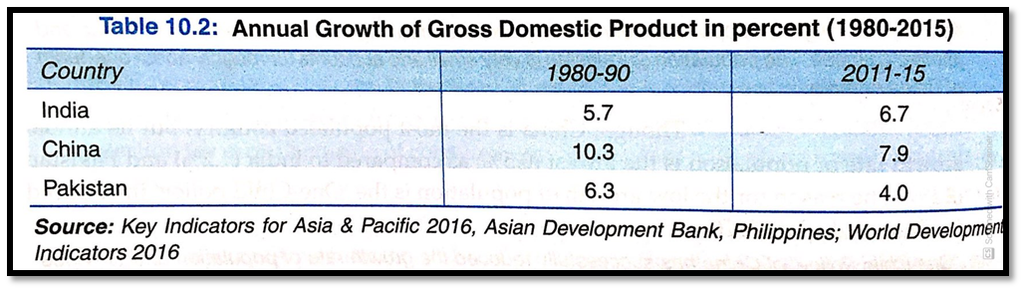
During 1980-90:
- China was having double-digit growth of 10.3%;
- Pakistan’s growth rate was 6.3%;
- India was at the bottom with just a 5.7% growth rate.
During 2011-15:
- There was a drastic fall in China's growth rate from 10.3% to 7.9%.
- Pakistan also met with a drastic decline in growth rate from 6.3% to 4%. As per some scholars, reform processes introduced in 1988 and political instability were the main reasons behind this decline.
- India recorded an increase from 5.7% to 6.7%
Sectoral Contribution
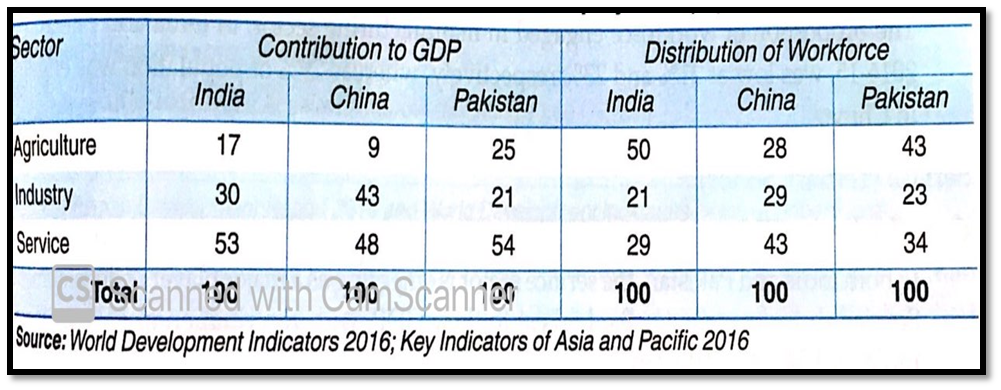
Agriculture (Primary Sector)
In China
- Due to topographic and climatic conditions, the area suitable for cultivation is just 10% of its total land area.
- The total cultivable area in China accounts for 40% of the cultivable area in India.
- Till 1980, more than 80% of its population was dependent on farming as their sole source of livelihood.
- Since then, the government encouraged people to leave their fields and pursue other &lefties, such as handicrafts, commerce and transport.
- As a result, proportion of workforce engaged in agriculture reduced to 28% in 2014-15, with a contribution to GDP of 9%.
In India
- The contribution of agriculture to GDP was 17%. The proportion of workforce engaged in agriculture was 50%.
In Pakistan
The contribution of agriculture to GDP was the same at 25%, but the proportion of workforce engaged in agriculture was 43% as compared to 50% of India.
Industry (Secondary Sector)
- Contribution to GDP: In China, manufacturing and service sectors contribute the highest to GDP at 43 and 48 per cent, respectively whereas in India and Pakistan, it is the service sector that contributes the highest by more than 50 percent of GDP.
- In China, secondary sector contributed 43% to China's GDP, whereas in India and Pakistan, the share of secondary sector was 30% and 21% respectively.
- Proportion of Workforce: In the normal course of development, China has been shifting employment and output from agriculture to manufacturing and then to services. In India and Pakistan, the shift is taking place directly in the service sector.
- The proportion of workforce engaged in manufacturing sector, in India and Pakistan in 21101715, was low at 21% and 23% respectively, whereas 29% of population was engaged in China.
Service (Tertiary Sector)
- Contribution to GDP: In both India and Pakistan, the service sector is emerging as a major player in development. Service sector contributes the highest to their GDP, with contribution of 53% in case of India and 54% for Pakistan.
- The contribution of service sector to the GDP in China was 32%.
- Proportion of workforce: In the 1980s, Pakistan was faster in shifting its workforce to service sector than India and China.
- The proportion of workforce engaged in service sector in 1980 for India, China and Pakistan were 17%, 12% and 27%. It reached the level of 29%, 43% and 34% respectively in 2014.
Conclusion
- In the last two decades, the contribution of agriculture sector to GDP, which employs the largest proportion of workforce in all the three countries, has declined.
- In the industrial sector, China has maintained a double-digit growth rate, whereas, for India and Pakistan, growth rate has declined.
- In case of service sector, China was able to raise its rate of growth during 1980-2015, while growth. India and Pakistan stagnated with their service sector growth.
- So, China's growth is mainly contributed by the manufacturing sector and India's growth by the service sector. During this period, Pakistan has shown deceleration in all three sectors.
Human Development Indicators
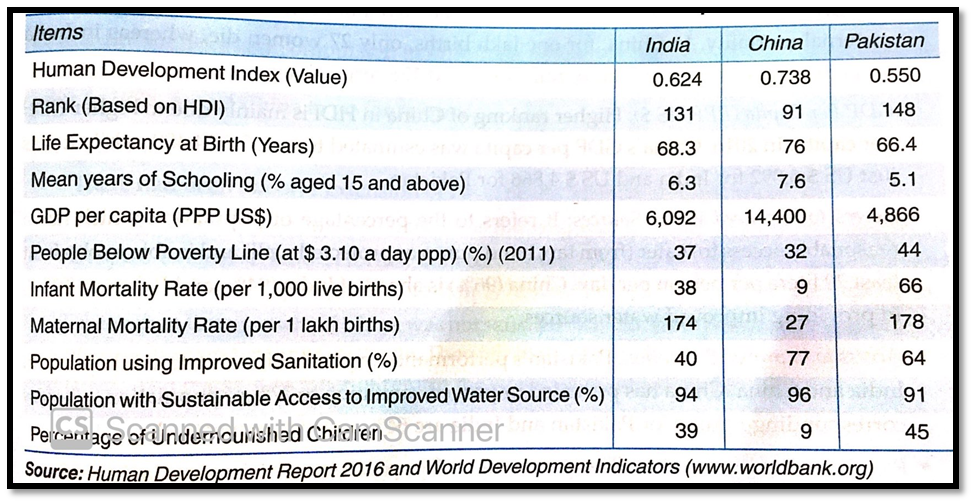
- Human Development Index (HD1):
- HDI is an important indicator to study the human development. Higher value of HDI shows the higher level of growth and development of a country.
- In 2016, HDI for India, China and Pakistan was estimated to be 0.624, 0.738 and 0.550 respectively.
- According to their HDI, Global ranks accorded were found to be 131, 91 and 148 respectively.
- Life Expectancy at Birth:
- Life expectancy refers to the average number of years for which people are expected to live. A higher life expectancy indicates longer and a more active average life span. China has the highest life expectancy of 76 years. India and Pakistan have the life expectancy of 68.3 and 66.4 years respectively.
- Mean years of Schooling:
- It is highest in case of China with 7.6%, while the corresponding figures for India and Pakistan are 6.3% and 5.1% respectively.
- Infant Mortalitv Rate (IMR):
- Infant mortality rate refers to number of infants dying before reaching one year of age per 1,000 live births in a year. Low IMR shows better health and sanitation facilities as most of the infants die due to unhygienic and insanitary environments. It is lowest in China with 9 infants and highest in Pakistan with 66 infants. IMR in India is 38.
- People below Poverty Line:
- People below the poverty line are the people who do not even have that level of income and expenditure, which is necessary to meet specified minimum levels of calorie intake. For the proportion of people below the international poverty rate of $ 3.10 a day, people below poverty line are 37%, 32% and 44% for India, China and Pakistan respectively.
- Maternal Mortality Rate:
- Both India and Pakistan have not been able to save women from maternal mortality. In China, for one lakh births, only 27 women die, whereas in India and Pakistan, maternal mortality rate is 174 and 178 respectively.
- GDP per capita (PPP US $):
- Higher ranking of China in HDI is mainly due to higher GDP per capita. In 2016, China's GDP per capita was estimated to be US $ 14,400, while it was just US $ 6,092 for India and US $ 4,866 for Pakistan.
- Access to improved Wafer Sources:
- It refers to the percentage of population which has a reasonable access to water (from tap, hand pump or protected well) and is able to obtain at least 20 liters per person per day. China (96%) is ahead of India (94%) and Pakistan (91%), in providing improved water sources.
- Access to improved Sanitation:
- Pakistan's performance in providing sanitation is better than India and China. China has provided improved sanitation to 77% of population, whereas corresponding figures for Pakistan and India are 64% and 40% respectively.
- Population undernourished:
- The percentage of population, which is not able to obtain adequante diet, is termed an undernourished population. China has the lowest percentage of population (9%), which is being undernourished. In India, 39% and in Pakistan, 45% of the population was undernourished.
Liberty Indicators:
- Human development indicators are all extremely important, but not sufficient. Along with these, we also need liberty indicators.
- Liberty Indicator may be defined as the measure of the extent of demographic participation in social and political decision making.
- Examples of liberty indicators: (i) Measures of the extent of the Constitutional Protection Rights given to the citizens; (ii) Extent of the Constitutional Protection of the independence of the Judiciary and Rule of Law. Human development index may be said to be incomplete unless such indicators are included.
ANALYSIS OF DEVELOPMENT STRATEGIES
Appraisal of Development Strategies
Developmental strategies of a country act as a model to others for lessons and guidance for their own development.
China
China did not have any compulsion to introduce reforms as dictated by the World Bank and International Monetary Fund to India and Pakistan. But, some adverse situations in the economy prior to 1978, forced China to go for reforms.
Pre Reforms Period:
- There had been a massive extension of basic health services in rural areas.
- Through the commune system, there was a more equitable distribution of food grains.
- Despite extensive land reforms, collectivization, the Great Leap Forward and other initiatives, the per capita grain output in 1978 was the same as it was in the mid-1950s.
- In 1978, the then Government of China was not satisfied with the slow pace of the economy and lack of modernization under Maoist rule. They felt that the Maoist vision of economic development had failed. As a result, a number of reform measures were introduced in 1978.
Post Reforms Period:
- Each reform measure was first implemented at a smaller level and then extended on a massive scale.
- Development of infrastructural facilities in the areas of education and health, land reforms, long existence of decentralized planning and existence of small enterprises helped positively in improving the social and income indicators.
- Agricultural reforms (handing over plots of land to individuals for cultivation) brought prosperity to a vast number of poor people. It created conditions for the subsequent phenomenal growth in rural industries and built up a strong support base for more reforms.
Pakistan
In Pakistan, the reform process led to a worsening of all the economic indicators. As compare• to 1980s, the growth rate of GDP and its sectoral constituents decreased in the 1990s. The proportion of poor in 1960s was more than 40 percent which declined to 25 percent in 1980sand started rising again in 1990s.
The reasons for the slow-down of growth and re-emergence of poverty in Pakistan's economy are:
- Agricultural growth and food supply situation was based on good harvest and not the institutionalized process of technical change. When there was a good harvest, the economy was in good condition when it was not, the economic indicators showed stagnation.
- Foreign exchange is an essential component for any country and it is always to build foreign exchange reserves through exports of manufactured goods. However, in Pakistan, most of the foreign exchange earnings came from remittances from Pakistani workers in the middle east and the exports of highly volatile agricultural products.
- There was a growing dependence on foreign loans on the one hand and increasing difficulty in paying back the loans on the other.
- However, during the last few years, Pakistan has recovered its economic growth and has been sustaining.
CONCLUSION
Conclusions
INDIA
- Indian economy performed moderately, but the majority of its people still depend on agriculture.
- Infrastructure is lacking in many parts of the country.
- It is yet to raise the standard of living of more than one-fourth of its population that lives below the poverty line.
PAKISTAN
- Political instability, over-dependence on remittances and foreign aid along with the volatile performance of the agriculture sector are the reasons for the slowdown of the Pakistan economy.
- In the recent past, it is hoping to improve the situation by maintaining high rates of GDP growth.
- Many macroeconomic indicators began showing positive and higher growth rates reflecting the economic recovery.
CHINA
- In China, the lack of political freedom and its implications for human rights are major concerns.
- However, in the last three decades, it used the 'market system without losing political commitment' and succeeded in raising the level of growth along with alleviation of poverty.
- China has used the market mechanism to create additional social and economic opportunities
- By retaining collective ownership of land and allowing individuals to cultivate land, China has ensured social security in a rural area
- Public intervention in providing social infrastructure brought positive results in human development indicators in China.
