 ACME SMART PUBLICATION
- Books Name
- A TEXT OF BIOLOGY - CLASS XII
- Publication
- ACME SMART PUBLICATION
- Course
- CBSE Class 12
- Subject
- Biology
BIODIVERSITY
Immense diversity (heterogenity) occurs at all levels of biological organisation. Three most important of them are:
(i) Genetic Diversity :
Genetic diversity refers to the variation of genes within species.
The differences could be in alleles (different variants of same genes), in entire genes or in chromosomal structures.
The genetic diversity enables a population to adapt to its environment and to respond to natural selection.
If a species has more genetic diversity, it can adapt better to the changed environmental conditions.
Lower diversity in a species leads to uniformity, as in the case with large monocultures of genetically similar crop plants.
This has advantage when increased crop production is a consideration, but can be a problem when an insect or a fungal disease attacks the field and possess a threat to the whole crop.
The total genetic diversity of a community will be greater if there are many species, as compared to a situation where there are only a few species.
Genetic diversity within a species often increases with environmental variability.
(a) It is measure of variety in genetic information contained in the organism e.g., virus = 10-150 genes, Mycoplasma = 450-700 genes, Oryza sativa = 32,000-50000 genes etc. India has >50,000 genetically different strains of rice and 1000 varieties of mango. The genetic variation shown by the medicinal plant Rauwolfia vomitoria growing in different Himalayan ranges might be in terms of the potency and concentration of the active chemical (reserpine).
(b) It enables a population to adopt to its environment.
(c) It helps in formation of ecotype.
(d) It plays a key role in process of speciation.
(e) It maintains diversity at community level.
(ii) Species Diversity
It is the variety of species within a region e.g., Western ghats are more diverse than eastern ghats, w.r.t. amphibians.
(a) Species diversity is product of species richness and species evenness.
(b) Species richness is the number of species present within a unit area.
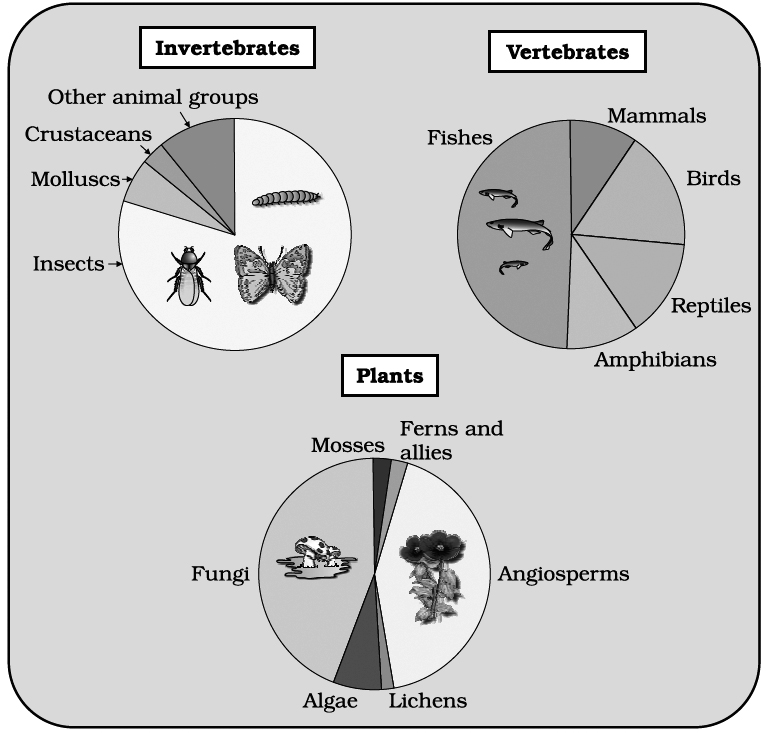
(c) Species evenness or species equitability is the proportionate number of individuals of different species (taxonomic groups). Communities where species are represented by more or less equal number of individuals exhibit evenness. Others where one or more species have more individuals than others show dominance or uneveness.
(d) Maximum / taxonomic diversity occurs where species of taxonomically different groups occur in almost equal abundance.
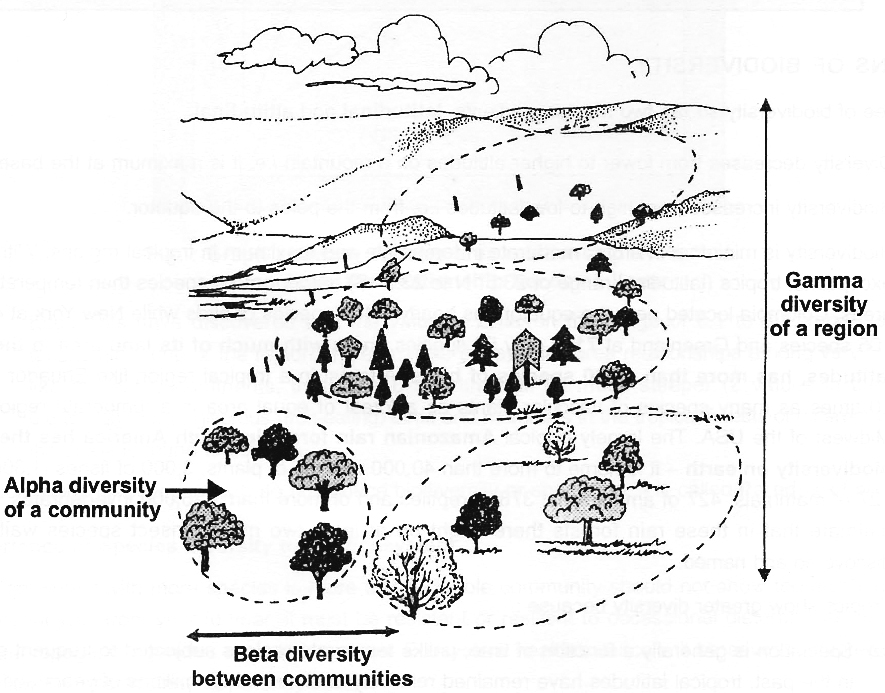
(iii) Community or Ecosystem Diversity
Diversity at the level of community and ecosystem has three perspectives.
Alpha diversity () refers to the diversity of organisms sharing the same community or habitat.
It is also called local diversity and is diversity within a community.
The rate of replacement of species along a gradient of habitats or communities is called beta diversity ().
It is calculated by dividing by diversity and is diversity between two communities.
Diversity of the habitats over the total landscape or geographical area is called gamma diversity (), also called regional diversity.
It represents the total richness of species in all the habitats found within a region, geographical area or landscape. e.g., India is more diverse than Norway.
India, is endowed with a rich diversity of the biogeographical regions due to varying physical conditions and species groupings.
Wild life institute of india has divided the country into ten biogeographical regions.
Among the 10 biogeographical regions, Deccan peninsula has the most extensive coverage of the Indian landmass (42%).
The most biodiversity-rich zones, Western Ghats and north-east, account for 4 and 5.2% of the geographical area, respectively.
Each biogeographical zone has several habitats, biotic communities and ecosystems.
A large number of species found in these zones are endemic or exclusive to India.
About 33% of the flowering plants recorded in India are endemic to our country.
Indian region is also notable for endemic fauna.
The endemics are concentrated mainly in North-East, Western Ghats, North-West Himalayas and Andaman and Nicobar Islands.
A very high number of amphibian species are endemic to Western Ghats.
PATTERNS OF BIODIVERSITY
Degree of biodiversity shows two master gradients, latitudinal and altitudinal.
(i) Diversity decreases from lower to higher altitudes on a mountain i.e. it is maximum at the base.
(ii) Biodiversity increases from high to low latitudes i.e. from the poles to the equator.
(iii) Biodiversity is minimum in arctic, moderate in temperate and maximum in tropical regions. With very few exceptions, tropics (latitudinal range of 23.5º N to 23.5º S) harbour more species than temperate or polar areas. Colombia located near the equator has nearly 1,400 species of birds while New York at 41º N has 105 species and Greenland at 71º N only 56 species. India with much of its land area in the tropical latitudes, has more than 1,200 species of birds. A forest in a tropical region like Equador has up to 10 times as many species of vascular plants as a forest of equal area in a temperate region like the Midwest of the USA. The largely tropical Amazonian rain forest in South America has the greatest biodiversity on earth -it is home to more than 40,000 species of plants, 3,000 of fishes, 1,300 of birds, 427 of mammals, 427 of amphibians, 378 of reptiles and of more than 1,25,000 invertebrates. Scientists estimate that in these rain forests there might be at least two million insect species waiting to be discovered and named.
(iv) Tropics show greater diversity because :
(a) Speciation is generally a function of time, unlike temperate regions subjected to frequent glaciations in the past, tropical latitudes have remained relatively undisturbed for millions of years and thus, had a long evolutionary time for species diversification,
(b) Tropical environment is less seasonal, relatively more constant and predictable, and can promote niche specialisation and lead to a greater species diversity.
(c) There is more solar energy available in the tropics, which contributes higher productivity; this in turn might contribute indirectly to greater diversity.
(v) Species-area relationships: Alexander von Humboldt observed that within a region species richness increases with increasing explored area, but only up to a limit. In fact, the relation between species richness and area for a wide variety of taxa (angiosperm plants, birds, bats, freshwater fishes) turns out to be a rectangular hyperbola.
The relationship is a straight line described by the equation
log S = log C + Z log A
where
S = Species richness, A = Area, Z = Slope of the line (regression coefficient), C = Y-intercept.
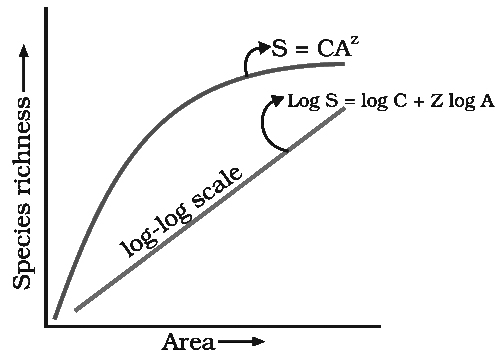
Note that on log scale the relationship becomes linear
Fig. : Graph showing species area relationship.Note that on log scale the relationship becomes linear
Ecologists have discovered that the value of Z lies in the range of 0.1 to 0.2, regardless of the taxonomic group or the region. If we analyse the species-area relationships among very large areas like the entire continents, the slope of the line will be much steeper (Z values in the range of 0.6 to 1.2). For frugivorous (fruit-eating) birds and mammals in the tropical forests of different continents, the slope is found to be 1.15.
(vi) Conditions favouring growth do not induce biodiversity or speciation, it is called Paradox of enrichment.
Importance of Species Diversity to the Ecosystem
1. Community with more species is more stable. Stable community should not show too much variation in productivity from year to year; it must be resistant or resilient to occassional disturbances by natural or anthropogenic agencies and alien species. Ecosystem health/balance will be severly affected if species extinction (particularly key stone) occurs.
2. Results of David Tilman's long term ecosystem experiments using outdoor plots.
(a) Plots with more species showed less year to year variation in total biomass.
(b) Increased diversity contributed to higher productivity.
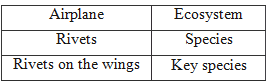
3. Rivet popper hypothesis (by Paul Ehrlich)
LOSS OF BIODIVERSITY
(i) IUCN red list documents extinctions of 784 species [including 338 vertebrates, 359 invertebrates and 87 plants] in the last 500 years.
(ii) Some recent extinctions -Dodo (Mauritius), Quagga (Africa), Thylacine (Australia), Steller's sea cow (Russia), and three subspecies (Bali, Javan, Caspian) of tiger.
(iii) 27 species have been disappeared in last 20 years.
(iv) Presently 12% birds sp., 23% of all mammals, 32% of all amphibians, and 31% of all gymnosperms in the world are facing the threat of extinction (more than 15,500 species).
(v) Sixth extinction is 100-1000 times more faster.
(vi) This may lead to decline in plant production, lowered resistance, increased variability in ecosystem processes e.g., pest and disease cycle.
(vii) The colonisation of tropical pacific islands by humans is said to have led to the extinction of > 2,000 species of native birds.
Causes of Biodiversity Loss
The process of extinction has been rather rapid during the last one hundred years because of increasing exploitation of wild life by man, who is gradually emerging as major evolutionary force. About 10% of the living species are threatened with extinction.
The factors contributing to extinction of species are discussed below:
1. Destruction of habitats:
Habitat destruction is the most serious threat to the wild life.
It is primary cause of extinction.
The most dramatic examples of habitat loss come from tropical rain forests. Once covering >14% of the earth's land surface, these now cover no more than 6%.
The Amazon rain forest (lungs of the planet) harbouring probably millions of species is being cut and cleared for cultivating soyabeans or for conservation to grasslands for raising beef cattle.
These are destroyed by many human activities as explained below :
(i) Deforestation: Deforestation deprives the wild life of its cover and food because of destruction of wild plants. It reduces the area of their free movement that retards the reproductive capacity of certain animals like rhino, tiger, etc.
(ii) Developmental work: The various developmental works like roads, railways, industries, mines, human settlements, dams, harbours, reservoirs, pastures, croplands, plantations etc. have reduced the natural habitats of wild life.
(iii) Habitat fragmentation: Large habitats are broken into small fragments. It reduces core area and increase edge area. Mammals and birds requiring large territories and migratory animals are badly affected.
2. Overexploitation:
Hunting of animals for food, safety and pleasure has been in practice ever since the appearance of man.
Large scale destruction of wild life occurred with use of fire as a means of hunting.
Excessive hunting has caused the disappearance of cheetah, the fastest mammal of India and dodo (Oidus ineptus), a unique bird of Mauritius.
Dodo of Mauritius, Pessenger pigeon, Stellers sea cow and Tasmanian wolf have become extinct due to overexploitation.
Heath Hen disappeared due to both hunting and habitat destruction.
3. Introduction of exotic species:
Exotic (alien) species on becoming invasive is considered another potent factor for extinction of species.
Examples of some exotic species:
Water Hyacinth (Eichhornia crassipes), Lantana (Lantana camara), Congress grass (Parthenium hysterophorus), Nile perch, Eupatorium (Eupatorium odoratum) and African catfish (Clarias gariepinus).
The native species are adversely affected by intentional or chance introduction of exotic species.
The Nile perch introduced into lake victoria in east Africa led eventually to the extinction of >200 species of cichlid fish in the lake.
The recent illegal introduction of the African catfish Clarias gariepinus for aquaculture purposes is posing a threat to the indigenous catfishes in our rivers.
4. Coextinction of coevolved species, which are related in a obligatory way e.g., plant-pollinator insect mutualism.
Habitat loss and fragmentation, Over-exploitation, Alien species invasions and Coextinction are 4 major causes of biodiversity losses (The Evil Quartet).
Susceptibility to Extinction
Species more susceptible to extinction have following population characteristics.
(i) Large body size (e.g., Rhinoceros, Lion)
(ii) Small population size and low reproductive rate (e.g., Giant Panda, Blue Whale).
(iii) High trophic level in food chain (e.g., Bald Eagle, Bengal Tiger).
(iv) Fixed habitat and migratory routes (e.g., Whooping Crane, Blue Whale).
