 SUDIP CHAKRABORTY
1. Liquidity Ratios

LIQUIDITY RATIOS
Ratio analysis is the quantitative interpretation of the company’s financial performance. It provides valuable information about the organization’s profitability, solvency, operational efficiency and liquidity positions as represented by the financial statements.
The following are the different types of ratios that are considered;
A liquidity ratio is a type of financial ratio used to determine a company’s ability to pay its short-term debt obligations. The metric helps determine if a company can use its current, or liquid, assets to cover its current liabilities
Types of Liquidity Ratios
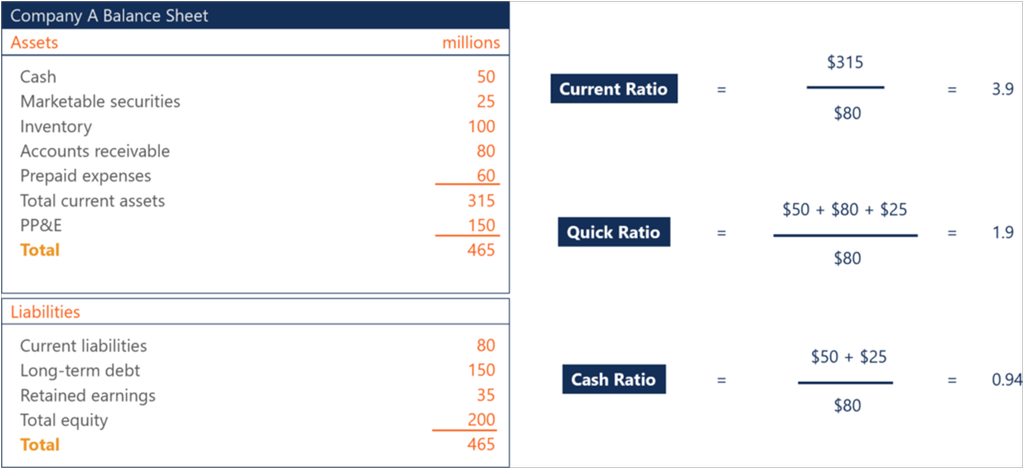
1. Current Ratio
Current Ratio = Current Assets / Current Liabilities
The current ratio is the simplest liquidity ratio to calculate and interpret. Anyone can easily find the current assets and current liabilities line items on a company’s balance sheet. Divide current assets by current liabilities, and you will arrive at the current ratio.
2. Quick Ratio
Quick Ratio = (Cash + Accounts Receivables + Marketable Securities) / Current Liabilities
The quick ratio is a stricter test of liquidity than the current ratio. Both are similar in the sense
that current assets is the numerator, and current liabilities is the denominator.
However, the quick ratio only considers certain current assets. It considers more liquid assets such as cash, accounts receivables, and marketable securities. It leaves out current assets such as inventory and prepaid expenses because the two are less liquid. So, the quick ratio is more of a true test of a company’s ability to cover its short-term obligations.
3. Cash Ratio
Cash Ratio = (Cash + Marketable Securities) / Current Liabilities
The cash ratio takes the test of liquidity even further. This ratio only considers a company’s most liquid assets – cash and marketable securities. They are the assets that are most readily available to a company to pay short-term obligations.
In terms of how strict the tests of liquidity are, you can view the current ratio, quick ratio, and cash ratio as easy, medium, and hard.
Important Notes
Since the three ratios vary by what is used in the numerator of the equation, an acceptable ratio will differ between the three. It is logical because the cash ratio only considers cash and marketable securities in the numerator, whereas the current ratio considers all current assets.
Therefore, an acceptable current ratio will be higher than an acceptable quick ratio. Both will be higher than an acceptable cash ratio. For example, a company may have a current ratio of 3.9, a quick ratio of 1.9, and a cash ratio of 0.94. All three may be considered healthy by analysts and investors, depending on the company.
Importance of Liquidity Ratios
1. Determine the ability to cover short-term obligations
Liquidity ratios are important to investors and creditors to determine if a company can cover their short-term obligations, and to what degree. A ratio of 1 is better than a ratio of less than 1, but it isn’t ideal.
Creditors and investors like to see higher liquidity ratios, such as 2 or 3. The higher the ratio is, the more likely a company is able to pay its short-term bills. A ratio of less than 1 means the company faces a negative working capital and can be experiencing a liquidity crisis.
2. Determine creditworthiness
Creditors analyze liquidity ratios when deciding whether or not they should extend credit to a company. They want to be sure that the company they lend to have the ability to pay them back. Any hint of financial instability may disqualify a company from obtaining loans.
Solvency ratios should not be confused with liquidity ratios. They are totally different. Liquidity ratios determine the capability of a business to manage its short-term liabilities while the solvency ratios are used to measure a company’s ability to pay long-term debts.
2. Solvency Ratios, Activity Ratios
SOLVENCY RATIOS
The solvency ratio is calculated from the components of the balance sheet and income statement elements. Solvency ratios help in determining whether the organization is able to repay its long-term debt. It is very important for the investors to know about this ratio as it helps in knowing about the solvency of a company or an organization.
Let us see in detail the various types of solvency ratios.
1. Debt to equity ratio
Debt to equity is one of the most used debt solvency ratios. It is also represented as the D/E ratio. Debt to equity ratio is calculated by dividing a company’s total liabilities with the shareholder’s equity. These values are obtained from the balance sheet of the company’s financial statements.
It is an important metric that is used to evaluate a company’s financial leverage. This ratio helps understand if the shareholder’s equity has the ability to cover all the debts in case the business is experiencing a rough time.
It is represented as
Debt to equity ratio = Long-term debt / shareholder’s funds
Or
Debt to equity ratio = total liabilities / shareholders’ equity
A high debt-to-equity ratio is associated with a higher risk for the business as it indicates that the company is using debt for fuelling its growth. It also indicates lower solvency of the business.
2. Debt Ratio
calculated by taking the total liabilities and dividing it by total capital. If the debt ratio is higher, it represents the company is riskier.
The debt ratio is a financial ratio that is used in measuring a company’s financial leverage. It is
The long-term debts include bank loans, bonds payable, notes payable etc.
The debt ratio is represented as
Debt Ratio = Long Term Debt / Capital or Debt Ratio = Long Term Debt / Net Assets
Low debt to capital ratio is indicative of a business that is stable while a higher ratio casts doubt about a firm’s long-term stability. Trading on equity is possible with a higher ratio of debt to capital which helps generate more income for the shareholders of the company.
3. Proprietary Ratio or Equity Ratio
Proprietary ratios is also known as equity ratio. It establishes a relationship between the proprietor's funds and the net assets or capital.
It is expressed as
Equity Ratio = Shareholder’s funds / Capital or Shareholder’s funds / Total Assets
4. Interest Coverage Ratio
The interest coverage ratio is used to determine whether the company is able to pay interest on the outstanding debt obligations. It is calculated by dividing the company’s EBIT (Earnings before interest and taxes) by the interest payment due on debts for the accounting period.
It is represented as
Interest coverage ratio = EBIT / interest on long term debt
Where EBIT = Earnings before interest and taxes or Net Profit before interest and tax.
A higher coverage ratio is better for the solvency of the business while a lower coverage ratio indicates a debt burden on the business.
ACTIVITY RATIOS
The role of activity ratio or turnover ratio is in the evaluation of the efficiency of a business by careful analysis of the inventories, fixed assets and accounts receivables.
Let us discuss the types of activity ratios.
Types of Activity Ratios
- Stock Turnover ratio or Inventory Turnover Ratio
- Debtors' Turnover ratio or Accounts Receivable Turnover Ratio
- Creditors Turnover ratio or Accounts Payable Turnover Ratio
- Working Capital turnover ratio.
- Investment Turnover Ratio
Stock Turnover Ratio
This is one of the most important turnover ratios which highlights the relationship between the inventory or stock in the business and the cost of the goods sold. It shows how fast the inventory gets cleared in an accounting period or in other words, the number of times the inventory or the stock gets sold or consumed. For this reason, it is also known as the inventory turnover ratio.
It is calculated by the following formula
Stock Turnover Ratio = Cost of Goods Sold / Average Inventory
A high stock turnover ratio is indicative of fast-moving goods in a company while a low stock turnover ratio indicates that goods are not getting sold and are being stored at warehouses for an extended period of time.
Debtor Turnover Ratio
This ratio is an important indicator of a company which shows how well a company is able to provide credit facilities to its customers and at the same time is also able to recover the due amount within the payment period.
It is also known as the accounts receivable turnover ratio as the payments for credit sales that will be received in the future are known as accounts receivables.
The formula for calculating the Debtor Turnover ratio is
Debtor Turnover Ratio = Credit Sales / Average Debtors
A higher ratio indicates that the credit policy of the company is sound, while a lower ratio shows a weak credit policy.
Creditors Turnover Ratio
The creditors turnover ratio is a measure of the capability of the company to pay off the amount for credit purchases successfully in an accounting period.
It shows the number of times the account payables are cleared by the company in an accounting period. For this reason, it is also known as the Accounts payable turnover ratio.
The formula for calculating creditors turnover ratio is
Creditors Turnover ratio = Net Credit Purchases / Average Creditors
Where average creditors are also known as average accounts payable.
A high ratio is indicative that a company is able to finance all the credit purchases and vice versa.
Working Capital Turnover Ratio
This ratio is helpful in determining the effectiveness with which a company is able to utilize its working capital for generating sales of its goods.
The formula for calculating the working capital turnover ratio is
Working capital turnover ratio = Sale or Costs of Goods Sold / Working Capital
If a company has a higher level of working capital it shows that the working capital of the business is utilized properly and on the other hand, a low working capital suggests that the business has too many debtors and the inventory is unused.
Investment Turnover Ratio or Net Asset Turnover Ratio
The investment Turnover Ratio is related to the sales taking place in the business and the net assets or the capital employed. It determines the ability of the business to generate sales revenue by the use of the net assets of the business. The ratio is calculated using the following formula
Investment Turnover Ratio = Net Sales/ Capital Employed
Importance of Activity Ratios
Activity ratios are very important indicators of the operating efficiency of the business. It also shows the way in which revenue is generated in a company and the way in which the elements of the balance sheet are utilized for managing the business.
Profitability ratios are a type of accounting ratio that helps in determining the financial performance of a business at the end of an accounting period. Profitability ratios show how well a company is able to make profits from its operations.
3. Profitability Ratios
PROFITABILITY RATIOS
The following are the types of profitability ratios discussed below
- Gross Profit Ratio
- Operating Ratio
- Operating Profit Ratio
- Net Profit Ratio
- Return on Investment (ROI)
- Return on Net Worth
- Earnings per share
- Book Value per share
- Dividend Payout Ratio
- Price Earnings Ratio
Gross Profit Ratio
The gross Profit Ratio is a profitability ratio that measures the relationship between the gross profit and net sales revenue. When it is expressed as a percentage, it is also known as the Gross Profit Margin.
The formula for Gross Profit ratio is
Gross Profit Ratio = Gross Profit/Net Revenue of Operations × 100
A fluctuating gross profit ratio is indicative of inferior product or management practices.
Operating Ratio
The operating ratio is calculated to determine the cost of operation in relation to the revenue earned from the operations.
The formula for the operating ratio is as follows
Operating Ratio = (Cost of Revenue from Operations + Operating Expenses)/
Net Revenue from Operations ×100
Operating Profit Ratio
The operating profit ratio is a type of profitability ratio that is used for determining the operating profit and net revenue generated from the operations. It is expressed as a percentage.
The formula for calculating the operating profit ratio is:
Operating Profit Ratio = Operating Profit/ Revenue from Operations × 100
Or
Operating Profit Ratio = 100 – Operating ratio
Net Profit Ratio
The net profit ratio is an important profitability ratio that shows the relationship between net sales and net profit after tax. When expressed as a percentage, it is known as net profit margin.
The formula for the net profit ratio is
Net Profit Ratio = Net Profit after tax ÷ Net sales
Or
Net Profit Ratio = Net profit/Revenue from Operations × 100
It helps investors in determining whether the company’s management is able to generate profit from the sales and how well the operating costs and costs related to overhead are contained.
Return on Capital Employed (ROCE) or Return on Investment (ROI)
Return on capital employed (ROCE) or Return on Investment is a profitability ratio that measures how well a company is able to generate profits from its capital. It is an important ratio that is mostly used by investors while screening for companies to invest.
The formula for calculating Return on Capital Employed is :
ROCE or ROI = EBIT ÷ Capital Employed × 100
Where EBIT = Earnings before interest and taxes or Profit before interest and taxes
Capital Employed = Total Assets – Current Liabilities
Return on Net Worth
This is also known as Return on shareholders' funds and is used for determining whether the investment done by the shareholders are able to generate profitable returns or not.
It should always be higher than the return on investment which otherwise would indicate that the company funds are not utilized properly.
The formula for Return on Net Worth is calculated as :
Return on Shareholders’ Fund = Profit after Tax / Shareholders’ Funds × 100
Or
Return on Net Worth = Profit after Tax / Shareholders’ Funds × 100
Earnings Per Share (EPS)
Earnings per share or EPS is a profitability ratio that measures the extent to which a company earns a profit. It is calculated by dividing the net profit earned by outstanding shares.
The formula for calculating EPS is:
Earnings per share = Net Profit ÷ Total no. of shares outstanding
Having higher EPS translates into more profitability for the company.
Book Value Per Share
Book value per share is referred to as the equity that is available to the common shareholders divided by the number of outstanding shares
Equity can be calculated by:
Equity funds = Shareholders funds – Preference share capital
The formula for calculating book value per share is:
Book Value per Share = (Shareholders’ Equity – Preferred Equity) / Total Outstanding Common Shares.
Dividend Payout Ratio
The dividend payout ratio calculates the amount paid to shareholders as dividends in relation to the amount of net income generated by the business.
It can be calculated as follows:
Dividend Payout Ratio (DPR): Dividends per share / Earnings per share
Price Earning Ratio
This is also known as P/E Ratio. It establishes a relationship between the stock (share) price of a company and the earnings per share. It is very helpful for investors as they will be more interested in knowing the profitability of the shares of the company and how much profitable it will be in the future.
The P/E ratio is calculated as follows:
P/E Ratio = Market value per share ÷ Earnings per share
It shows if the company’s stock is overvalued or undervalued.
