 KRISHNA PUBLICATIONS
- Books Name
- AMARENDRA PATTANAYAK Mathmatics Book
- Publication
- KRISHNA PUBLICATIONS
- Course
- CBSE Class 11
- Subject
- Mathmatics
Chapter 15
Statistics
Statistics : Measures of Dispersion:
A measure of central tendency gives us a rough idea where data points are centred.
the measures of central tendency are not sufficient to give complete information about a given data. Variability is another factor which is required to be studied under statistics. Like ‘measures of central tendency’ we want to have a single number to describe variability. This single number is called a ‘measure of dispersion’.
In statistics, dispersion (also called variability, scatter, or spread) is the extent to which a distribution is stretched or squeezed. Common examples of measures of statistical dispersion are the variance, standard deviation, and interquartile range. For instance, when the variance of data in a set is large, the data is widely scattered. On the other hand, when the variance is Small, the data in the set is clustered.
A measure of statistical dispersion is a nonnegative real number that is zero if all the data are the same and increases as the data become more diverse.

Most measures of dispersion have the same units as the quantity being measured. In other words, if the measurements are in metres or seconds, so is the measure of dispersion.
Dispersion is contrasted with location or central tendency, and together they are the most used properties of distributions.
A measure of dispersion indicates the scattering of data. It explains the disparity of data from one another, delivering a precise view of their distribution. The measure of dispersion displays and gives us an idea about the variation and the central value of an individual item.
OR
the measures of dispersion help to interpret the variability of data i.e. to know how much homogenous or heterogeneous the data is. In simple terms, it shows how squeezed or scattered the variable is.
Measures of dispersion are vital because they can show you the within a specific sample, or group of people. When it comes to samples, that dispersion is important because it determines the margin of error you'll have when making inferences about measures of central tendency, like averages.
The variation can be measured in different numerical measures, namely:
(i) Range: It is the simplest method of measurement of dispersion and defines the difference between the largest and the smallest item in a given distribution. If Y max and Y min are the two ultimate items, then
Range = Y max – Y min
(ii) Quartile deviation: It is known as semi-interquartile range, i.e., half of the difference between the upper quartile and lower quartile. The first quartile is derived as Q, the middle digit Q1 connects the least number with the median of the data. The median of a data set is the (Q2) second quartile. Lastly, the number connecting the largest number and the median is the third quartile (Q3). Quartile deviation can be calculated by
Q = ½ × (Q3 – Q1)
(iii) Mean deviation: Mean deviation is the arithmetic mean (average) of deviations ⎜MD ⎜of observations from a central value (mean or median).
Mean deviation can be evaluated by using the formula: ![]()
Thus mean deviation about a central value ‘A’ is the mean of the absolute values of the deviations of the observations
from ‘A’. The mean deviation from ‘a’ is denoted as M.D. (A).
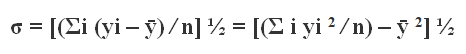
(iv) Standard deviation: Standard deviation is the square root of the arithmetic average of the square of the deviations measured from the mean. The standard deviation is given as,
Mean
The average of the given set of data is computed by dividing the total number of numbers by the sum of the given numbers.
Mean = (Sum of all observations/Total number of observations)
Mean for Ungrouped Data
Example:
There are 20 pupils in a class, and their grades are 88, 82, 88, 85, 84, 80, 81, 82, 83, 85, 84, 74, 75, 76, 89, 90, 89, 80, 82, and 83.
The mean is the sum of the percentages obtained
= [88 + 82 + 88 + 85 + 84 + 80 + 81 + 82 + 83 + 85 + 84 + 74 + 75 + 76 + 89 + 90 + 89 + 80 + 82 + 83] /20 = 1660/20 = 83 %
Mean for Grouped Data
In statistics, the mean, or arithmetic mean, of a group of numbers is the sum of the numbers divided by the number of numbers in the group. The mean is a measure of the central tendency of a group of numbers.
When dealing with grouped data, the mean is calculated by first finding the midpoint of each group, then finding the sum of the numbers in each group, and finally dividing the sum by the number of groups.
