 KRISHNA PUBLICATIONS
- Books Name
- AMARENDRA PATTANAYAK Mathmatics Book
- Publication
- KRISHNA PUBLICATIONS
- Course
- CBSE Class 11
- Subject
- Mathmatics
Mean deviation, range, variance and standard deviation of grouped and ungrouped data:
Range of Ungrouped Data
We know now that range is the difference between the maximum and minimum value. Hence for ungrouped data, we arrange the series in ascending or descending order. This helps us to select the highest and lowest values in the distribution. Henceforth, we simply subtract the minimum value from the maximum value.
Example :
The marks of a student in 5 tests of the chapter statistics are(out of 20)- 11, 14, 16, 13 and 18.
Arranging them in ascending order- 18, 16, 14, 13 and 11. The range of the data is given as- 18-11=7.
Range= Maximum value – Minimum value
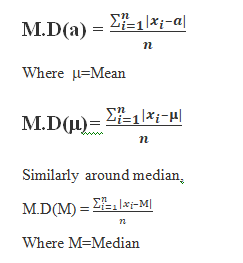
Mean Deviation for Ungrouped Data
Mean deviation measures the dispersion of data about a measure of central tendency. This measure of central tendency is generally median or mean. How to calculate mean and median for individual distribution series.
Calculating Mean and Median
For calculation of median, we first arrange the data in ascending or descending order(generally ascending order). Further, we count the number of observations which is denoted by n. Now depending on whether n is even or odd, the further calculation is bifurcated as:
- If n is an odd number then the value of (n+1)/2th item is the median.
- If n is an even number then median is given as: [ value of (n+1)/2th item + value of (n/2 +1)th item]÷2
Mean is simply calculated as the ration of summation of observations to the number of observations.
Mean= Sum of observations/number of observations
Steps to Calculate the Mean Deviation for Ungrouped data
To calculate the mean deviation for ungrouped data, the following steps are followed:
Let the set of data consist of observations.
Step i) The measure of central tendency about which mean deviation is to be found out is calculated. Let a be assumed mean.
Step ii) Calculate the absolute deviation of each observation from the measure of central tendency calculated in step (i) i.e.,
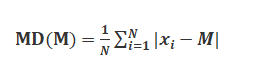
Step iii) Evaluate the mean of all the absolute deviations. This gives the mean absolute deviation (M.D) about ‘a‘ for ungrouped data i.e.,
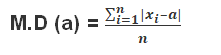
In case the measure of central tendency is mean the above equation can be rewritten as:
Mean Deviation Formulas for Grouped Data:
Mean deviation for grouped data We know that data can be grouped into
two ways :
(a) Discrete frequency distribution,
(b) Continuous frequency distribution.
Let us discuss the method of finding mean deviation for both types of the data.
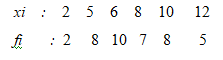
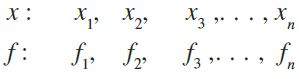
(a) Discrete frequency distribution Let the given data consist of n distinct values
x1, x2, ..., xn occurring with frequencies f1, f2 , ..., fn respectively. This data can be
represented in the tabular form as given below, and is called discrete frequency
distribution:
x : x1 x2 x3 ... xn
f : f1 f2 f3 ... fn
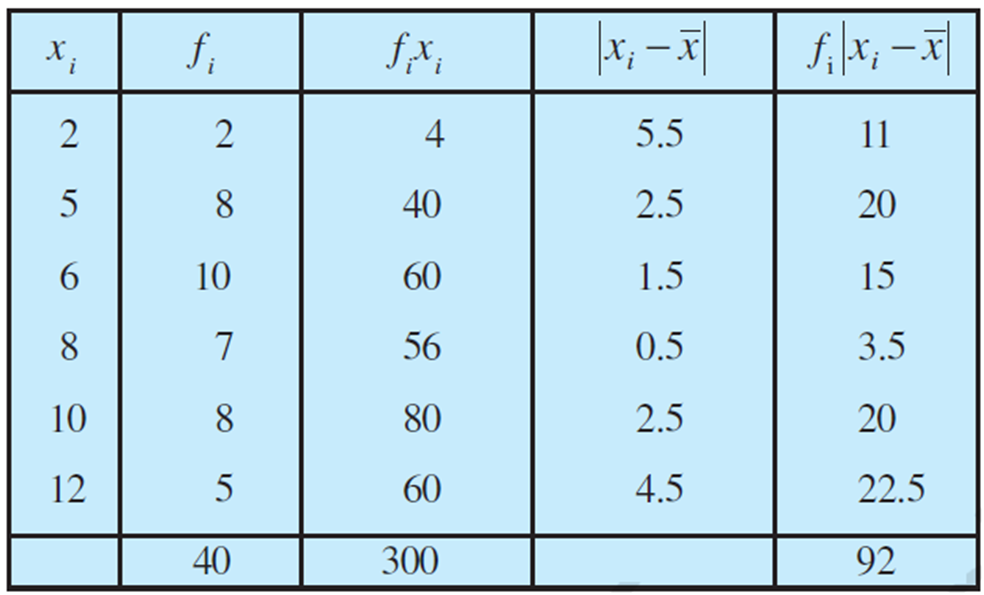
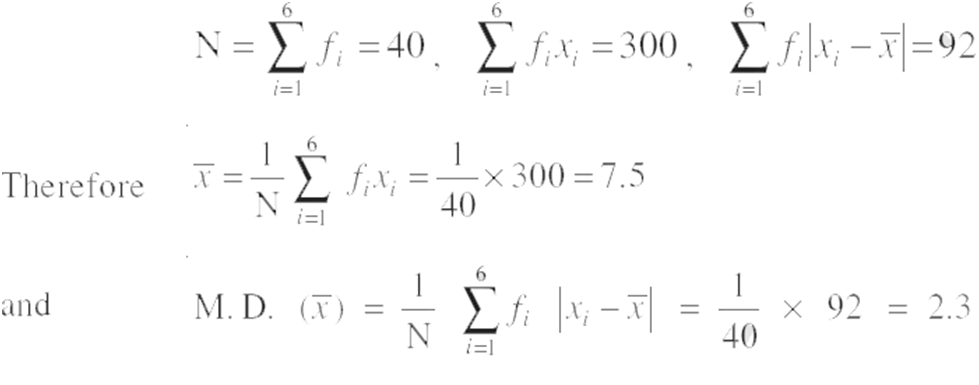
(i) Mean deviation about mean
First of all we find the mean x of the given data by using the formula
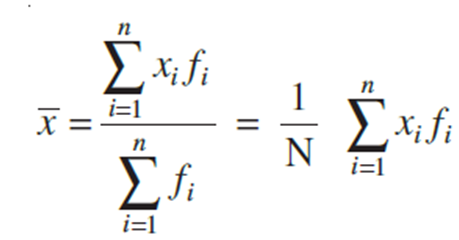
where  denotes the sum of the products of observations xi with their respective frequencies fi and
 ![]() is the sum of the frequencies.
is the sum of the frequencies.
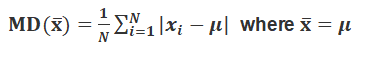
Then, we find the deviations of observations xi from the mean x and take their absolute values,
i.e.,| x- xi | for all i =1, 2,..., n.
After this, find the mean of the absolute values of the deviations, which is the required mean deviation about the mean. Thus
(ii) Mean deviation about median To find mean deviation about median, we find the median of the given discrete frequency distribution. For this the observations are arranged in ascending order. After this the cumulative frequencies are obtained. Then, we identify the observation whose cumulative frequency is equal to or just greater than N/2 , where N is the sum of frequencies. This value of the observation lies in the middle of the data, therefore, it is the required median. After finding median, we obtain the mean of the absolute values of the deviations from median .Thus,
where ![]() Median
Median
Example: Find mean deviation about the mean for the following data :
Solution:
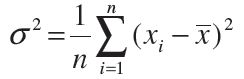
Variance:
A variance of zero indicates that all the values are identical. It should be noted that variance is always non-negative- a small variance indicates that the data points tend to be very close to the mean and hence to each other while a high variance indicates that the data points are very spread out around the mean and from each other.
Mean of the squares of the deviations from mean is called the variance and is denoted by
s2 (read as sigma square). Therefore, the variance of n observations x1, x2,..., xn is given by
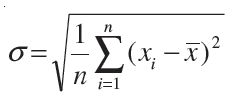
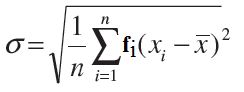
Standard Deviation : In the calculation of variance, we find that the units of individual observations xi and the unit of their mean x are different from that of variance, since variance involves the sum of squares of (xi– x ). For this reason, the proper measure of dispersion about the mean of a set of observations is expressed as positive square-root of the variance and is called standard deviation. Therefore, the standard deviation, usually denoted by s
Properties of Variance
- It is always non-negative since each term in the variance sum is squared and therefore the result is either positive or zero.
- Variance always has squared units. For example, the variance of a set of weights estimated in kilograms will be given in kg squared. Since the population variance is squared, we cannot compare it directly with the mean or the data themselves.
Variance Formulas for UnGrouped Data
Variance Formulas for Grouped Data
Standard deviation of a discrete frequency distribution: Let the given discrete
frequency distribution be
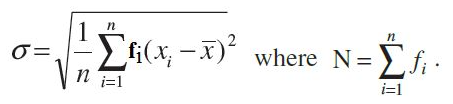
Standard deviation of a continuous frequency distribution: The given continuous frequency distribution can be represented as a discrete frequency distribution by replacing each class by its mid-point. Then, the standard deviation is calculated by the technique adopted in the case of a discrete frequency distribution.
If there is a frequency distribution of n classes each class defined by its mid-point
xi with frequency fi, the standard deviation will be obtained by
where ![]() is the mean of the distribution and
is the mean of the distribution and ![]()
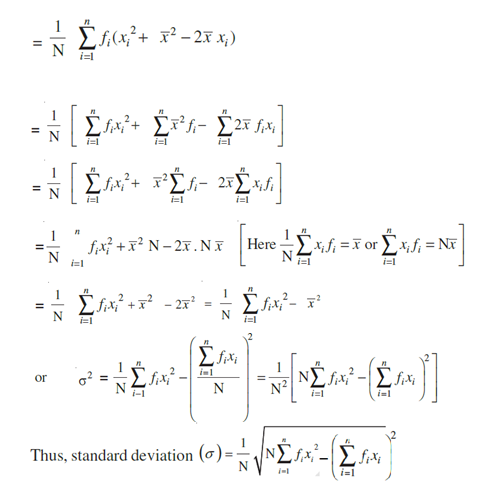
Another formula for standard deviation :
We know that
Variance (s2 ) = ![]()
Properties of Standard Deviation
- It describes the square root of the mean of the squares of all values in a data set and is also called the root-mean-square deviation.
- The smallest value of the standard deviation is 0 since it cannot be negative.
- When the data values of a group are similar, then the standard deviation will be very low or close to zero. But when the data values vary with each other, then the standard variation is high or far from zero.
Question: Find the variance for the following set of data representing trees heights in feet: 3, 21, 98, 203, 17, 9
Solution:
Step 1: Add up the numbers in your given data set.
3 + 21 + 98 + 203 + 17 + 9 = 351
Step 2: Square your answer:
351 × 351 = 123201
…and divide by the number of items. We have 6 items in our example so:
123201/6 = 20533.5
Step 3: Take your set of original numbers from Step 1, and square them individually this time:
3 × 3 + 21 × 21 + 98 × 98 + 203 × 203 + 17 × 17 + 9 × 9
Add the squares together:
9 + 441 + 9604 + 41209 + 289 + 81 = 51,633
Step 4: Subtract the amount in Step 2 from the amount in Step 3.
51633 – 20533.5 = 31,099.5
Set this number aside for a moment.
Step 5: Subtract 1 from the number of items in your data set. For our example:
6 – 1 = 5
Step 6: Divide the number in Step 4 by the number in Step 5. This gives you the variance:
31099.5/5 = 6219.9
Step 7: Take the square root of your answer from Step 6. This gives you the standard deviation:
σ =√6219.9 = 78.86634
The answer is 78.86.
Question :
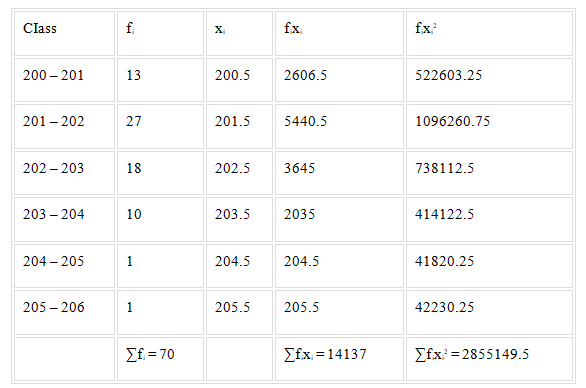
Calculate the variance for the following data:
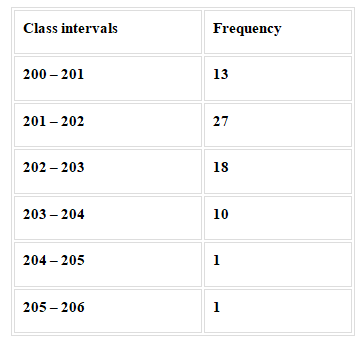
Solution:

What Are the merits and demerits of range?
Merits
- It is very easy to calculate and simple to understand.
- No special knowledge is needed while calculating range.
- It takes the least time for computation.
- It provides a broad picture of the data at a glance.
Demerits
- It is a crude measure because it is only based on two extreme values (highest and lowest).
- It cannot be calculated in the case of open-ended series.
- Range is significantly affected by fluctuations of sampling, i.e. it varies widely from sample to sample.
Merits and demerits of Quartile Deviation
Merits
- It is also quite easy to calculate and simple to understand.
- It can be used even in case of open-end distribution.
- It is less affected by extreme values so, it a superior to ‘Range’.
- It is more useful when the dispersion of the middle 50% is to be computed.
Demerits
- It is not based on all the observations.
- It is not capable of further algebraic treatment or statistical analysis.
- It is affected considerably by fluctuations of sampling.
- It is not regarded as a very reliable measure of dispersion because it ignores 50% observations.
What Are the merits and demerits of mean deviation?
Merits
- It is based on all the observations of the series and not only on the limits like Range and QD.
- It is simple to calculate and easy to understand.
- It is not much affected by extreme values.
- For calculating mean deviation, deviations can be taken from any average.
Demerits
- Ignoring + and – signs is bad from the mathematical viewpoint.
- It is not capable of further mathematical treatment.
- It is difficult to compute when the mean or median is in fraction.
- It may not be possible to use this method in case of open ended series.
