 ACERISE INDIA
Mode Of Grouped Data
Consider the following frequency table.
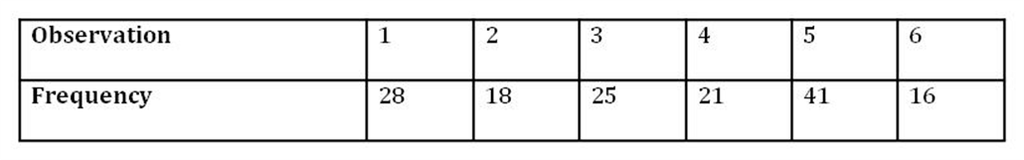
From the table, we can easily observe that the observation 5 has maximum frequency which is 41.
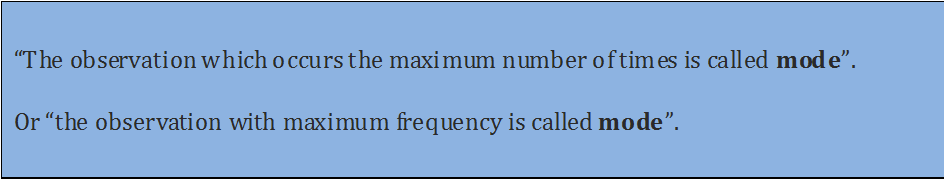
Thus, the mode of the given data is 5. Thus, the mode can be defined as
When the data is given in grouped form, we cannot find the mode by looking at the frequencies. Let us consider the following example.
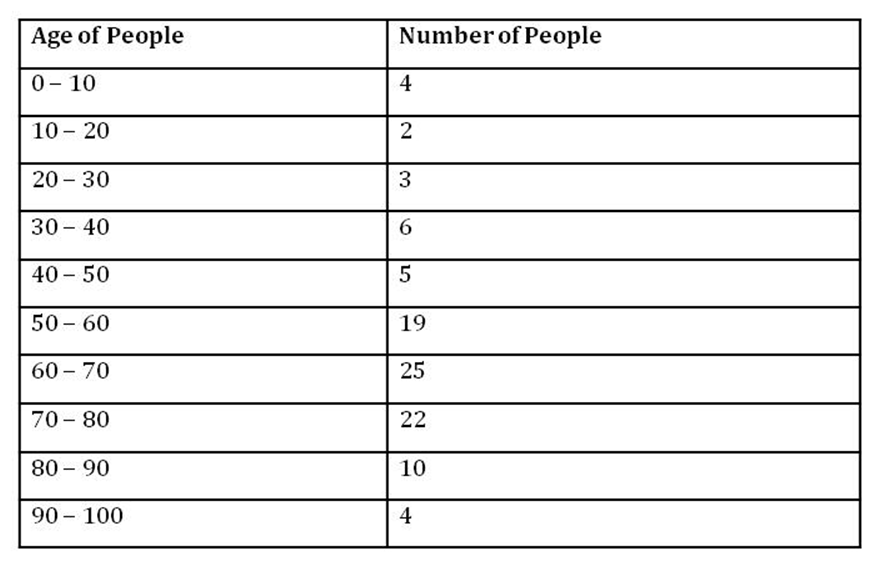
From the above table, we can observe that the maximum frequency is 25 and corresponds to the class interval of 60 − 70. However, we are not sure that exactly which value in the
class interval 60 − 70 is the mode because we do not know the actual age of these 25 people.
In such situations, we use a formula to find the mode. Therefore, first of all, let us look at the formula to be used in such cases.
The formula used to find the mode when the data is given in groups is as follows.
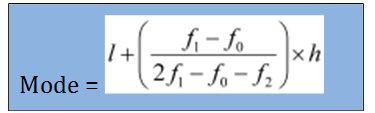
Where, l = lower limit of the modal class
h = size of class interval (all class sizes should be equal)
f1 = frequency of the modal class
f0 = frequency of the class preceding the modal class
f2 = frequency of the class succeeding the modal class
Before discussing the previous example, let us first know what a modal class is.
![]()
Let us discuss the previous example to understand the method of finding the mode, when the data is given in a grouped form.
Now, consider the previous example again.
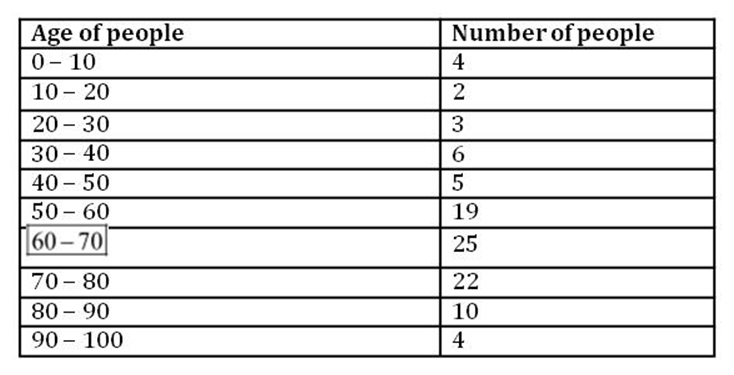
Here, the maximum frequency is 25, and this corresponds to the group 60 − 70. Therefore, the modal class is 60 − 70.
We can calculate the mode by using the following formula.
Mode =
From the above table,
l = 60
f1 = 25
f0 = 19
f2 = 22
h = 70 − 60 = 10
Using the formula,
Mode =
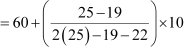
Mode =

= 60 + 6.67
= 66.67
Therefore, the mode of the given data is 66.67.
Here, we can observe that the mode lies inside the modal class 60 − 70. Let us solve more problems using this formula.
Example 1: The following table shows the class intervals and the frequency corresponding to them.
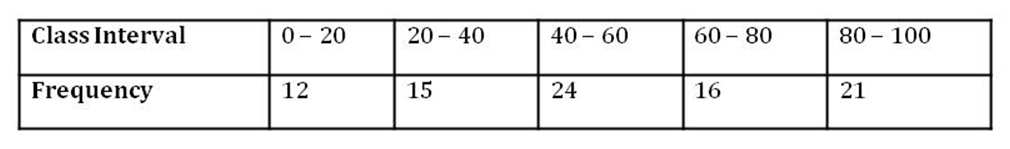
Find the mode of the given data.
Solution:
In the given table, the maximum frequency is 24 corresponding to the class interval 40 − 60. Therefore, the modal class is 40 − 60.
From the table,
l = 40
h = 20
f0 = 15
f2 = 16
f1 = 24
Mode =
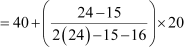
Mode =

= 40 + 10.59
= 50.59
Thus, the mode of the given data is 50.59.
Example 2: Data collected about the weights of 70 students of a class is given in the following table.
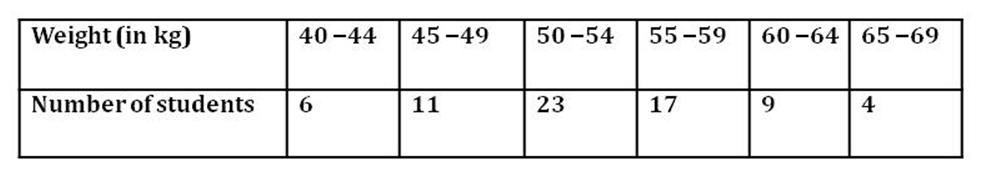
Find the modal weight of the class. Solution:
It can be seen that the class intervals are of inclusive type, so we need to make them of exclusive type to calculate the mode.
The modified table will be as follows:

Here, the maximum frequency is 23 which corresponds to the class interval 49.5 − 54.5. Therefore, the modal class is 49.5 − 54.5.
From the table, we have
l = 49.5
h = 5
f0 = 11
f2 = 17
f1 = 23
Mode =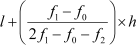
= 49.5 + 3.33
= 52.83
Thus, the modal weight of the class is 52.83 kg.
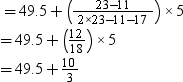
Example 3: If the modal class is 45 − 60 and mode of the distribution is 58, then find the missing frequency in the following table.
Solution:
The mode of the distribution is given as 58, which lies in the class interval 45 − 60. Hence, 45 − 60 is the modal class.
Let the frequency of modal class 45 − 60 be f. From the table,
l = 45
h = 15
f0 = 10
f2 = 21
f1 = f
Using the formula, mode = ,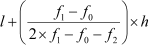
Mode =
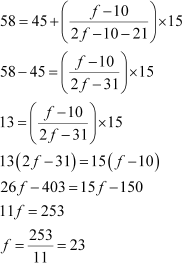
Thus, the missing frequency is 23.
